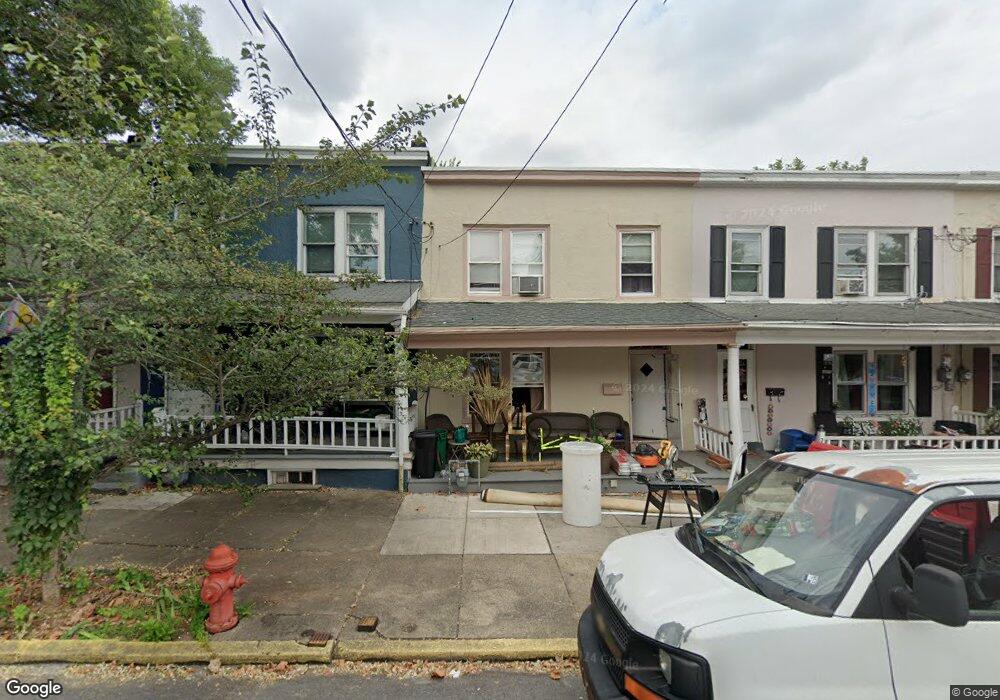
721 6th St Lancaster, PA 17603
West End NeighborhoodEstimated Value: $177,000 - $228,000
3
Beds
1
Bath
1,120
Sq Ft
$179/Sq Ft
Est. Value
About This Home
This home is located at 721 6th St, Lancaster, PA 17603 and is currently estimated at $200,686, approximately $179 per square foot. 721 6th St is a home located in Lancaster County with nearby schools including Smith-Wade-El Elementary School, Wheatland Middle School, and McCaskey High School.
Ownership History
Date
Name
Owned For
Owner Type
Purchase Details
Closed on
May 11, 2022
Sold by
Sarah Huber Lisa and Sarah Paul David
Bought by
Huber David P and Huber Lisa Sarah
Current Estimated Value
Purchase Details
Closed on
Jan 28, 2011
Sold by
Huber Lisa
Bought by
Huber David P
Purchase Details
Closed on
Jan 20, 2011
Sold by
Wells Fargo N A
Bought by
Huber Lisa
Purchase Details
Closed on
Jun 3, 2010
Sold by
Walker Anthony T
Bought by
Wells Fargo Bank Na
Create a Home Valuation Report for This Property
The Home Valuation Report is an in-depth analysis detailing your home's value as well as a comparison with similar homes in the area
Home Values in the Area
Average Home Value in this Area
Purchase History
We collect this data history from publicly available records. To have your information removed, we recommend requesting removal directly through your county’s website.
| Date | Buyer | Sale Price | Title Company |
|---|---|---|---|
| Huber David P | -- | None Listed On Document | |
| Huber David P | -- | None Available | |
| Huber Lisa | $50,000 | None Available | |
| Wells Fargo Bank Na | $3,033 | None Available |
Source: Public Records
Tax History
| Year | Tax Paid | Tax Assessment Tax Assessment Total Assessment is a certain percentage of the fair market value that is determined by local assessors to be the total taxable value of land and additions on the property. | Land | Improvement |
|---|---|---|---|---|
| 2026 | $2,803 | $70,100 | $20,400 | $49,700 |
| 2025 | $2,774 | $70,100 | $20,400 | $49,700 |
| 2024 | $2,774 | $70,100 | $20,400 | $49,700 |
| 2023 | $2,727 | $70,100 | $20,400 | $49,700 |
| 2022 | $2,614 | $70,100 | $20,400 | $49,700 |
| 2021 | $2,558 | $70,100 | $20,400 | $49,700 |
| 2020 | $2,558 | $70,100 | $20,400 | $49,700 |
| 2019 | $2,519 | $70,100 | $20,400 | $49,700 |
| 2018 | $1,495 | $70,100 | $20,400 | $49,700 |
| 2017 | $3,082 | $67,100 | $23,600 | $43,500 |
| 2016 | $3,054 | $67,100 | $23,600 | $43,500 |
| 2015 | $1,191 | $67,100 | $23,600 | $43,500 |
| 2014 | $2,665 | $67,100 | $23,600 | $43,500 |
Source: Public Records
Map
Nearby Homes
Your Personal Tour Guide
Ask me questions while you tour the home.