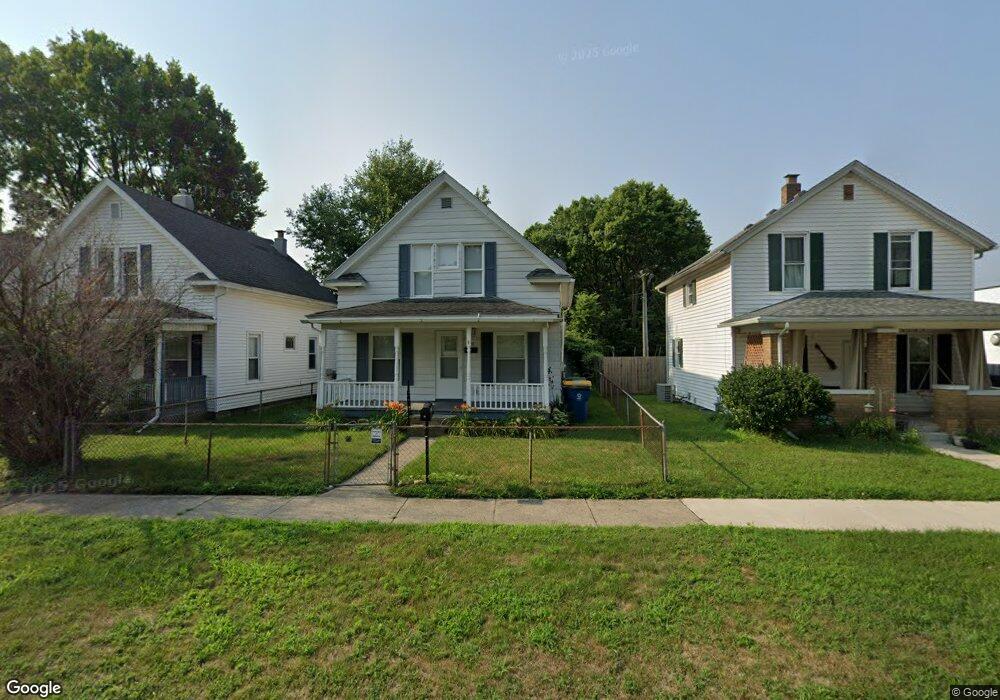
721 E 5th St Mishawaka, IN 46544
Estimated Value: $130,000 - $156,000
3
Beds
1
Bath
1,842
Sq Ft
$77/Sq Ft
Est. Value
About This Home
This home is located at 721 E 5th St, Mishawaka, IN 46544 and is currently estimated at $142,686, approximately $77 per square foot. 721 E 5th St is a home located in St. Joseph County with nearby schools including Emmons Elementary School, John J. Young Middle School, and Mishawaka High School.
Ownership History
Date
Name
Owned For
Owner Type
Purchase Details
Closed on
Mar 15, 2012
Sold by
St Joseph County Sheriff
Bought by
Five Star Investment Group V L
Current Estimated Value
Purchase Details
Closed on
Aug 9, 2006
Sold by
Sowders Linda
Bought by
Leland Nicole
Home Financials for this Owner
Home Financials are based on the most recent Mortgage that was taken out on this home.
Original Mortgage
$74,727
Interest Rate
6.78%
Mortgage Type
FHA
Purchase Details
Closed on
Aug 4, 2005
Sold by
Patterson Ray A
Bought by
Jp Morgan Chase Bank
Create a Home Valuation Report for This Property
The Home Valuation Report is an in-depth analysis detailing your home's value as well as a comparison with similar homes in the area
Home Values in the Area
Average Home Value in this Area
Purchase History
We collect this data history from publicly available records. To have your information removed, we recommend requesting removal directly through your county’s website.
| Date | Buyer | Sale Price | Title Company |
|---|---|---|---|
| Five Star Investment Group V L | $18,401 | -- | |
| Leland Nicole | -- | Metropolitan Title In Llc | |
| Jp Morgan Chase Bank | $52,000 | None Available |
Source: Public Records
Mortgage History
We collect this data history from publicly available records. To have your information removed, we recommend requesting removal directly through your county’s website.
| Date | Status | Borrower | Loan Amount |
|---|---|---|---|
| Previous Owner | Leland Nicole | $74,727 |
Source: Public Records
Tax History
| Year | Tax Paid | Tax Assessment Tax Assessment Total Assessment is a certain percentage of the fair market value that is determined by local assessors to be the total taxable value of land and additions on the property. | Land | Improvement |
|---|---|---|---|---|
| 2025 | $1,543 | $95,300 | $16,800 | $78,500 |
| 2024 | $1,543 | $66,000 | $9,200 | $56,800 |
| 2023 | $1,474 | $62,800 | $9,200 | $53,600 |
| 2022 | $2,376 | $101,300 | $16,800 | $84,500 |
| 2021 | $1,481 | $62,800 | $6,100 | $56,700 |
| 2020 | $1,187 | $50,200 | $7,700 | $42,500 |
| 2019 | $1,837 | $77,300 | $7,400 | $69,900 |
| 2018 | $1,455 | $48,900 | $6,100 | $42,800 |
| 2017 | $1,563 | $48,700 | $6,100 | $42,600 |
| 2016 | $1,493 | $48,700 | $6,100 | $42,600 |
| 2014 | $1,301 | $48,000 | $6,100 | $41,900 |
Source: Public Records
Map
Nearby Homes
Your Personal Tour Guide
Ask me questions while you tour the home.