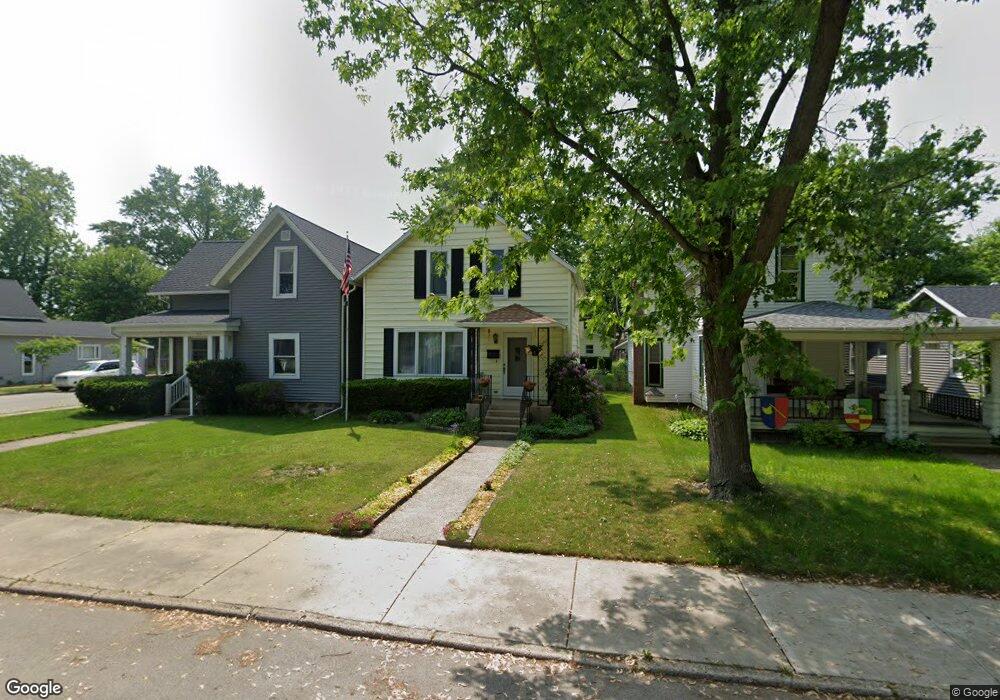
721 Emerson St Goshen, IN 46526
Shanklin Millrace NeighborhoodEstimated Value: $167,000 - $211,000
2
Beds
2
Baths
1,336
Sq Ft
$140/Sq Ft
Est. Value
About This Home
This home is located at 721 Emerson St, Goshen, IN 46526 and is currently estimated at $186,519, approximately $139 per square foot. 721 Emerson St is a home located in Elkhart County with nearby schools including Goshen Jr. High School, Goshen High School, and St. Vincent de Paul Elementary School.
Ownership History
Date
Name
Owned For
Owner Type
Purchase Details
Closed on
Aug 15, 2024
Sold by
Morgan Terry C and Revo Christine
Bought by
Heynis Collin
Current Estimated Value
Home Financials for this Owner
Home Financials are based on the most recent Mortgage that was taken out on this home.
Original Mortgage
$152,000
Outstanding Balance
$149,824
Interest Rate
6.77%
Mortgage Type
New Conventional
Estimated Equity
$36,695
Purchase Details
Closed on
Aug 10, 2000
Sold by
Morgan Terry C and Morgan Christine
Bought by
The Terry C & Christine Morgan Revocable
Create a Home Valuation Report for This Property
The Home Valuation Report is an in-depth analysis detailing your home's value as well as a comparison with similar homes in the area
Home Values in the Area
Average Home Value in this Area
Purchase History
| Date | Buyer | Sale Price | Title Company |
|---|---|---|---|
| Heynis Collin | $160,000 | Fidelity National Title Compan | |
| The Terry C & Christine Morgan Revocable | -- | -- |
Source: Public Records
Mortgage History
| Date | Status | Borrower | Loan Amount |
|---|---|---|---|
| Open | Heynis Collin | $152,000 |
Source: Public Records
Tax History
| Year | Tax Paid | Tax Assessment Tax Assessment Total Assessment is a certain percentage of the fair market value that is determined by local assessors to be the total taxable value of land and additions on the property. | Land | Improvement |
|---|---|---|---|---|
| 2025 | $1,818 | $151,300 | $14,500 | $136,800 |
| 2024 | $1,677 | $148,800 | $14,500 | $134,300 |
| 2022 | $1,677 | $122,800 | $14,500 | $108,300 |
| 2021 | $1,249 | $107,800 | $14,500 | $93,300 |
| 2020 | $1,282 | $101,600 | $14,500 | $87,100 |
| 2019 | $1,097 | $93,500 | $14,500 | $79,000 |
| 2018 | $977 | $88,500 | $14,500 | $74,000 |
| 2017 | $880 | $85,600 | $14,500 | $71,100 |
| 2016 | $881 | $84,200 | $14,500 | $69,700 |
| 2014 | $680 | $73,000 | $14,500 | $58,500 |
| 2013 | $753 | $75,300 | $14,500 | $60,800 |
Source: Public Records
Map
Nearby Homes
- 709 Emerson St
- 809 S 6th St
- 312 E Plymouth Ave
- 1104 Wilson Ave
- 308 E Madison St
- 902 S 8th St
- 420 S 8th St
- 313 S 7th St
- 1303 Wilson Ave
- 505 Franklin St
- 1323 S 8th St
- 1415 S Main St
- 60867 Indiana 15
- 904 S 14th St
- 1105 Egbert Ave
- 1315 E Reynolds St
- 1506 James Place
- 312 N Indiana Ave
- 1436 Hampton Cir
- 64288 Meadow Ridge Dr
Your Personal Tour Guide
Ask me questions while you tour the home.