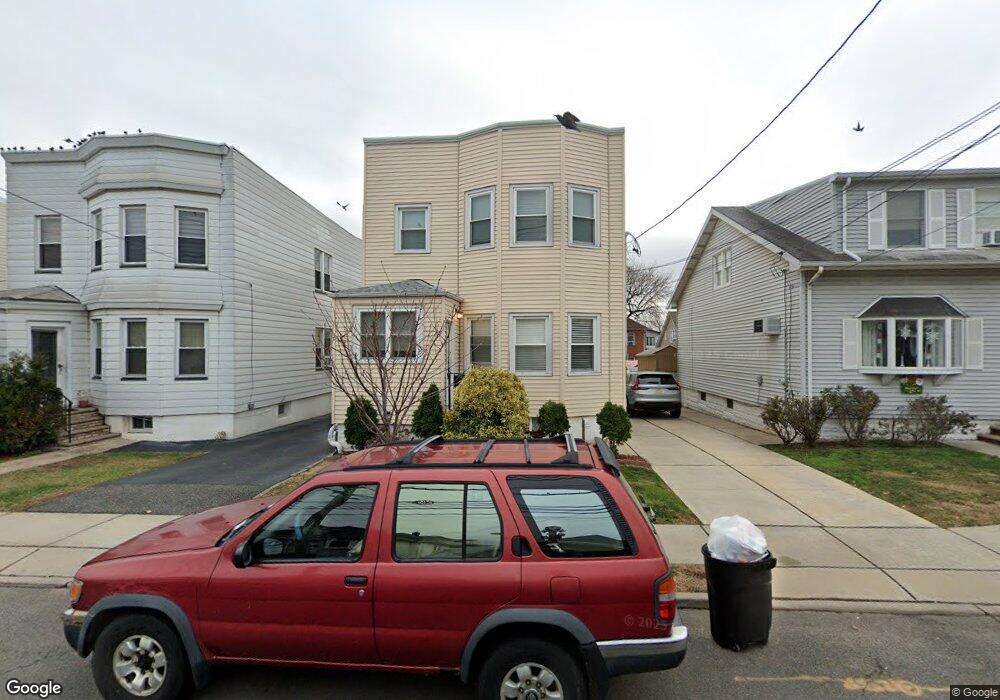
722 5th St Secaucus, NJ 07094
Estimated Value: $828,000 - $973,000
4
Beds
3
Baths
3,138
Sq Ft
$281/Sq Ft
Est. Value
About This Home
This home is located at 722 5th St, Secaucus, NJ 07094 and is currently estimated at $881,420, approximately $280 per square foot. 722 5th St is a home located in Hudson County with nearby schools including Secaucus High School.
Ownership History
Date
Name
Owned For
Owner Type
Purchase Details
Closed on
Sep 20, 2017
Sold by
Folingo Joyce and Bunker Miriam
Bought by
Yang Xi Lin and Chan Sandy
Current Estimated Value
Purchase Details
Closed on
Aug 13, 2005
Sold by
Foligno Joyce
Bought by
Foligno Joyce
Purchase Details
Closed on
Jun 11, 2001
Sold by
Foligno Michael A
Bought by
Foligno Michael A and Foligno Joyce
Create a Home Valuation Report for This Property
The Home Valuation Report is an in-depth analysis detailing your home's value as well as a comparison with similar homes in the area
Home Values in the Area
Average Home Value in this Area
Purchase History
| Date | Buyer | Sale Price | Title Company |
|---|---|---|---|
| Yang Xi Lin | $520,000 | Chicago Title Ins Co | |
| Foligno Joyce | -- | -- | |
| Foligno Michael A | -- | -- |
Source: Public Records
Tax History
| Year | Tax Paid | Tax Assessment Tax Assessment Total Assessment is a certain percentage of the fair market value that is determined by local assessors to be the total taxable value of land and additions on the property. | Land | Improvement |
|---|---|---|---|---|
| 2025 | $9,506 | $232,300 | $68,300 | $164,000 |
| 2024 | $9,220 | $232,300 | $68,300 | $164,000 |
| 2023 | $9,220 | $232,300 | $68,300 | $164,000 |
| 2022 | $8,741 | $232,300 | $68,300 | $164,000 |
| 2021 | $8,758 | $232,300 | $68,300 | $164,000 |
| 2020 | $6,276 | $168,000 | $68,300 | $99,700 |
| 2019 | $6,236 | $168,000 | $68,300 | $99,700 |
| 2018 | $6,065 | $168,000 | $68,300 | $99,700 |
| 2017 | $6,072 | $168,000 | $68,300 | $99,700 |
| 2016 | $6,228 | $168,000 | $68,300 | $99,700 |
| 2015 | $6,219 | $168,000 | $68,300 | $99,700 |
| 2014 | $6,327 | $168,000 | $68,300 | $99,700 |
Source: Public Records
Map
Nearby Homes
Your Personal Tour Guide
Ask me questions while you tour the home.