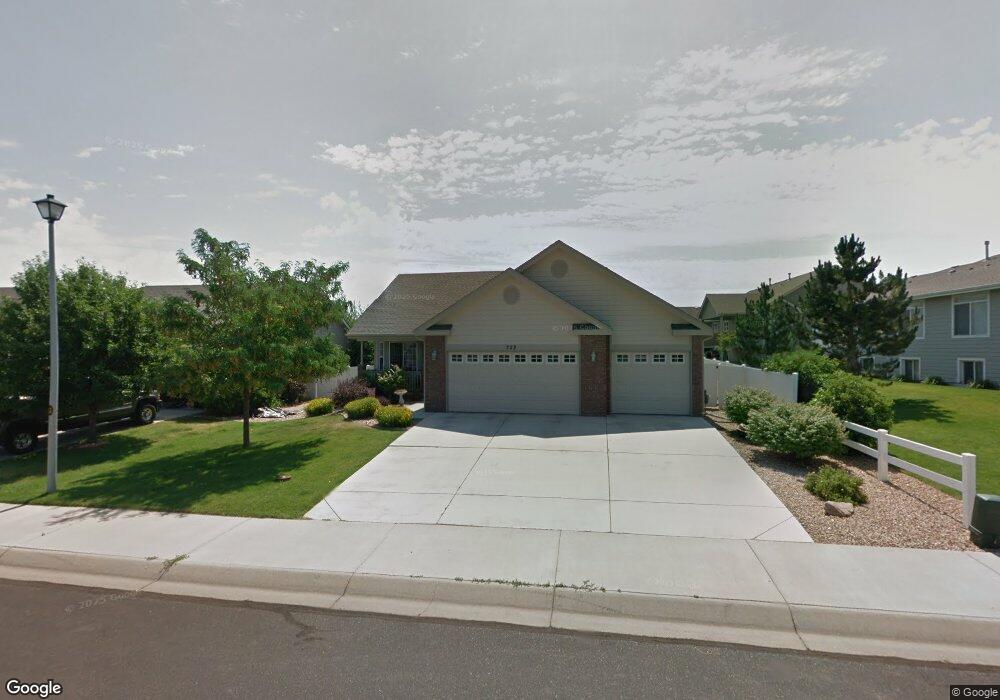
722 63rd Ave Greeley, CO 80634
Estimated Value: $427,193 - $450,000
3
Beds
2
Baths
1,196
Sq Ft
$364/Sq Ft
Est. Value
About This Home
This home is located at 722 63rd Ave, Greeley, CO 80634 and is currently estimated at $435,548, approximately $364 per square foot. 722 63rd Ave is a home located in Weld County with nearby schools including Northridge High School, West Ridge Academy Charter, and University Schools.
Ownership History
Date
Name
Owned For
Owner Type
Purchase Details
Closed on
Jan 4, 2006
Sold by
Kiekhaefer David N
Bought by
Debban Frederick A and Debban Kendra R
Current Estimated Value
Home Financials for this Owner
Home Financials are based on the most recent Mortgage that was taken out on this home.
Original Mortgage
$147,375
Outstanding Balance
$82,640
Interest Rate
6.23%
Mortgage Type
Fannie Mae Freddie Mac
Estimated Equity
$352,908
Purchase Details
Closed on
Jun 25, 2004
Sold by
Persimmon Hill Llc
Bought by
Kiekhaefer David N
Home Financials for this Owner
Home Financials are based on the most recent Mortgage that was taken out on this home.
Original Mortgage
$136,800
Interest Rate
5.5%
Mortgage Type
Unknown
Purchase Details
Closed on
Oct 20, 2003
Sold by
Pumpkin Ridge Llc
Bought by
Persimmon Hill Llc
Create a Home Valuation Report for This Property
The Home Valuation Report is an in-depth analysis detailing your home's value as well as a comparison with similar homes in the area
Purchase History
| Date | Buyer | Sale Price | Title Company |
|---|---|---|---|
| Debban Frederick A | $193,700 | Security Title | |
| Kiekhaefer David N | $171,000 | -- | |
| Persimmon Hill Llc | $51,500 | -- |
Source: Public Records
Mortgage History
| Date | Status | Borrower | Loan Amount |
|---|---|---|---|
| Open | Debban Frederick A | $147,375 | |
| Previous Owner | Kiekhaefer David N | $136,800 | |
| Closed | Kiekhaefer David N | $25,650 |
Source: Public Records
Tax History
| Year | Tax Paid | Tax Assessment Tax Assessment Total Assessment is a certain percentage of the fair market value that is determined by local assessors to be the total taxable value of land and additions on the property. | Land | Improvement |
|---|---|---|---|---|
| 2025 | $1,945 | $25,110 | $7,190 | $17,920 |
| 2024 | $1,945 | $25,110 | $7,190 | $17,920 |
| 2023 | $1,854 | $26,870 | $5,340 | $21,530 |
| 2022 | $1,945 | $22,310 | $5,350 | $16,960 |
| 2021 | $2,008 | $22,960 | $5,510 | $17,450 |
| 2020 | $1,893 | $21,720 | $3,580 | $18,140 |
| 2019 | $1,898 | $21,720 | $3,580 | $18,140 |
| 2018 | $1,411 | $17,040 | $2,230 | $14,810 |
| 2017 | $1,419 | $17,040 | $2,230 | $14,810 |
| 2016 | $1,177 | $15,910 | $1,270 | $14,640 |
| 2015 | $1,173 | $15,910 | $1,270 | $14,640 |
| 2014 | $1,044 | $13,820 | $1,270 | $12,550 |
Source: Public Records
Map
Nearby Homes
- 701 62nd Avenue Ct
- 608 63rd Ave
- 6208 W 8th St Unit A
- 617 62nd Ave
- 718 66th Ave
- 6604 7th St
- 416 66th Ave
- 6620 7th St
- 6637 W 6th St
- 6641 W 6th St
- 6609 4th Street Rd Unit 1
- 6717 4th Street Rd Unit 2
- 6719 4th Street Rd Unit 2
- 6611 4th Street Rd Unit 1
- 6615 4th Street Rd Unit 2
- 6603 W 3rd St Unit 1713
- 6603 W 3rd St Unit 1724
- 6603 W 3rd St Unit 1620
- 6806 W 3rd St Unit 26
- 1616 104th Ave Place
- 714 63rd Ave
- 6211 W 8th St Unit B
- 6213 W 8th St Unit A
- 717 62nd Avenue Ct
- 710 63rd Ave
- 6207 W 8th St
- 713 62nd Avenue Ct
- 723 63rd Ave
- 721 62nd Avenue Ct
- 706 63rd Ave
- 719 63rd Ave
- 6106-6106 W 8th St Unit 6104
- 727 63rd Ave Unit B
- 715 63rd Ave
- 705 62nd Avenue Ct
- 729 63rd Ave Unit 1A
- 711 63rd Ave
- 702 63rd Ave
- 801 63rd Ave Unit 2B
- 6210 W 8th St Unit A
Your Personal Tour Guide
Ask me questions while you tour the home.