722 Rathbun St Blackstone, MA 01504
Blackstone AreaEstimated Value: $397,572 - $442,000
About This Home
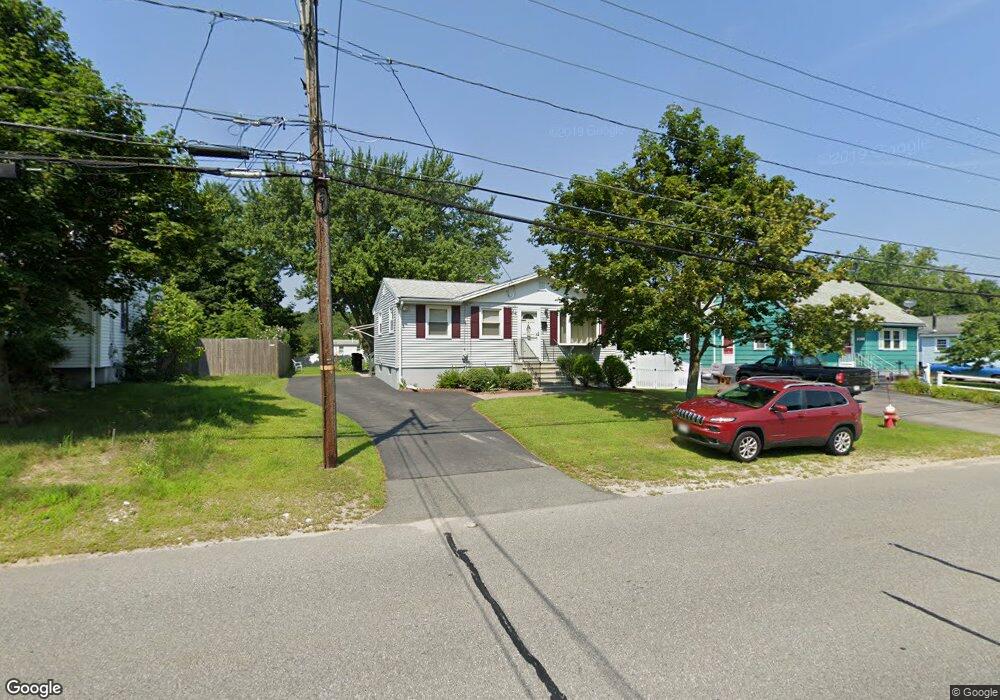
This home is located at 722 Rathbun St, Blackstone, MA 01504 and is currently estimated at $419,643, approximately $374 per square foot. 722 Rathbun St is a home located in Worcester County with nearby schools including Blackstone-Millville Regional High School, Rise Prep Mayoral Academy Middle School, and Rise Prep Mayoral Academy.
Ownership History
We collect this data history from publicly available records. To have your information removed, we recommend requesting removal directly through your county’s website.
Purchase Details
Purchase Details
Home Values in the Area
Average Home Value in this Area
Purchase History
We collect this data history from publicly available records. To have your information removed, we recommend requesting removal directly through your county’s website.
| Date | Buyer | Sale Price | Title Company |
|---|---|---|---|
| -- | None Available | ||
| $22,500 | -- |
Mortgage History
We collect this data history from publicly available records. To have your information removed, we recommend requesting removal directly through your county’s website.
| Date | Status | Borrower | Loan Amount |
|---|---|---|---|
| Previous Owner | $60,000 | ||
| Previous Owner | $40,000 |
Tax History
We collect this data history from publicly available records. To have your information removed, we recommend requesting removal directly through your county’s website.
| Year | Tax Paid | Tax Assessment Tax Assessment Total Assessment is a certain percentage of the fair market value that is determined by local assessors to be the total taxable value of land and additions on the property. | Land | Improvement |
|---|---|---|---|---|
| 2025 | $4,610 | $305,300 | $124,900 | $180,400 |
| 2024 | $4,892 | $299,600 | $124,900 | $174,700 |
| 2023 | $4,450 | $275,000 | $124,900 | $150,100 |
| 2022 | $4,686 | $261,800 | $125,700 | $136,100 |
| 2021 | $4,291 | $229,200 | $114,300 | $114,900 |
| 2020 | $4,315 | $228,800 | $114,300 | $114,500 |
| 2019 | $4,083 | $215,900 | $105,000 | $110,900 |
| 2018 | $3,799 | $194,900 | $100,000 | $94,900 |
| 2017 | $3,761 | $195,300 | $100,000 | $95,300 |
| 2016 | $3,723 | $192,500 | $90,300 | $102,200 |
| 2015 | $3,516 | $180,500 | $90,300 | $90,200 |
Map
- 21 Andrews St
- 39 Elvira St
- 4 Cheney St
- 16 Lakeview St
- 21 Miller St
- 53 Farm St
- 81 Winter St
- Lot 2 Pulaski Blvd
- 28 Richmond St
- 612 Rathbun St
- 12 Miller St
- 30 California Ave
- 13 Ethel St
- 360 S Main St
- 65 Bellingham St
- 0 Diamond Hill Rd Unit 1406968
- 67 Garden St
- Lot 4 Pickering Rd
- 76 Dewey St
- 1044 Social St Unit F
Ask me questions while you tour the home.