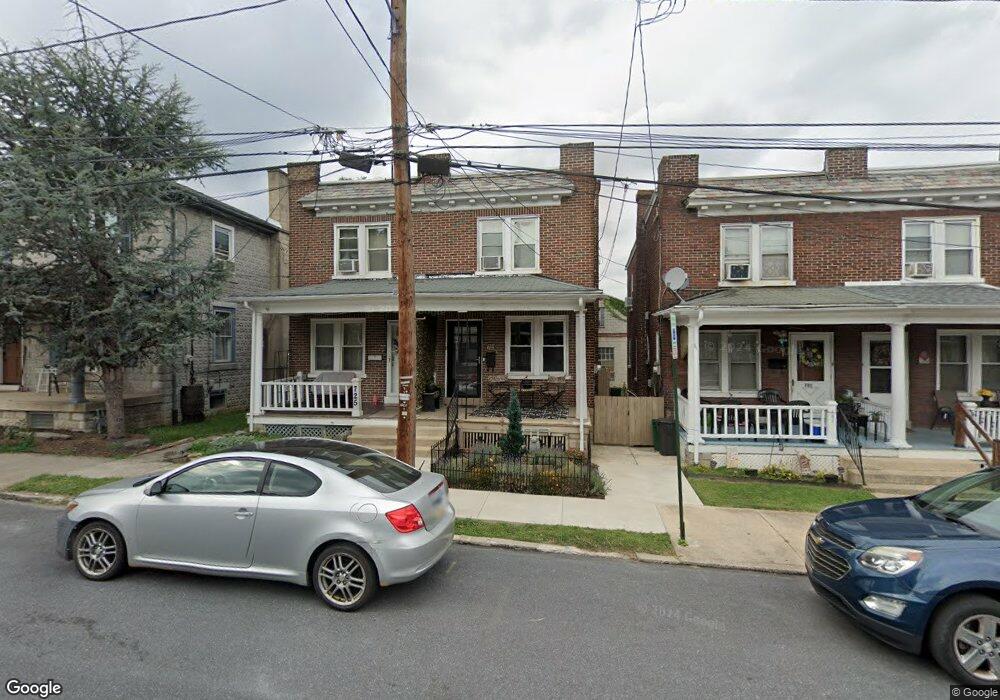
723 5th St Lancaster, PA 17603
West End NeighborhoodEstimated Value: $147,000 - $179,999
2
Beds
1
Bath
896
Sq Ft
$185/Sq Ft
Est. Value
About This Home
This home is located at 723 5th St, Lancaster, PA 17603 and is currently estimated at $165,750, approximately $184 per square foot. 723 5th St is a home located in Lancaster County with nearby schools including Smith-Wade-El Elementary School, Wheatland Middle School, and McCaskey High School.
Ownership History
Date
Name
Owned For
Owner Type
Purchase Details
Closed on
Oct 23, 2012
Sold by
Cicero Marguerite Mary and Cicero Frank B
Bought by
Aument Debra L and Rader Doris J
Current Estimated Value
Home Financials for this Owner
Home Financials are based on the most recent Mortgage that was taken out on this home.
Original Mortgage
$54,003
Outstanding Balance
$37,815
Interest Rate
3.75%
Mortgage Type
FHA
Estimated Equity
$127,935
Purchase Details
Closed on
Jan 26, 2012
Sold by
Cicero Frank B
Bought by
Cicero Mary
Purchase Details
Closed on
Nov 1, 2010
Sold by
Cicero Marguerite Mary
Bought by
Cicero Frank B
Create a Home Valuation Report for This Property
The Home Valuation Report is an in-depth analysis detailing your home's value as well as a comparison with similar homes in the area
Home Values in the Area
Average Home Value in this Area
Purchase History
We collect this data history from publicly available records. To have your information removed, we recommend requesting removal directly through your county’s website.
| Date | Buyer | Sale Price | Title Company |
|---|---|---|---|
| Aument Debra L | $55,000 | None Available | |
| Cicero Mary | -- | None Available | |
| Cicero Frank B | -- | None Available |
Source: Public Records
Mortgage History
We collect this data history from publicly available records. To have your information removed, we recommend requesting removal directly through your county’s website.
| Date | Status | Borrower | Loan Amount |
|---|---|---|---|
| Open | Aument Debra L | $54,003 |
Source: Public Records
Tax History
| Year | Tax Paid | Tax Assessment Tax Assessment Total Assessment is a certain percentage of the fair market value that is determined by local assessors to be the total taxable value of land and additions on the property. | Land | Improvement |
|---|---|---|---|---|
| 2025 | $2,782 | $70,300 | $17,500 | $52,800 |
| 2024 | $2,782 | $70,300 | $17,500 | $52,800 |
| 2023 | $2,735 | $70,300 | $17,500 | $52,800 |
| 2022 | $2,621 | $70,300 | $17,500 | $52,800 |
| 2021 | $2,565 | $70,300 | $17,500 | $52,800 |
| 2020 | $2,565 | $70,300 | $17,500 | $52,800 |
| 2019 | $2,526 | $70,300 | $17,500 | $52,800 |
| 2018 | $1,062 | $70,300 | $17,500 | $52,800 |
| 2017 | $2,535 | $55,200 | $15,700 | $39,500 |
| 2016 | $2,512 | $55,200 | $15,700 | $39,500 |
| 2015 | $980 | $55,200 | $15,700 | $39,500 |
| 2014 | $1,765 | $55,200 | $15,700 | $39,500 |
Source: Public Records
Map
Nearby Homes
Your Personal Tour Guide
Ask me questions while you tour the home.