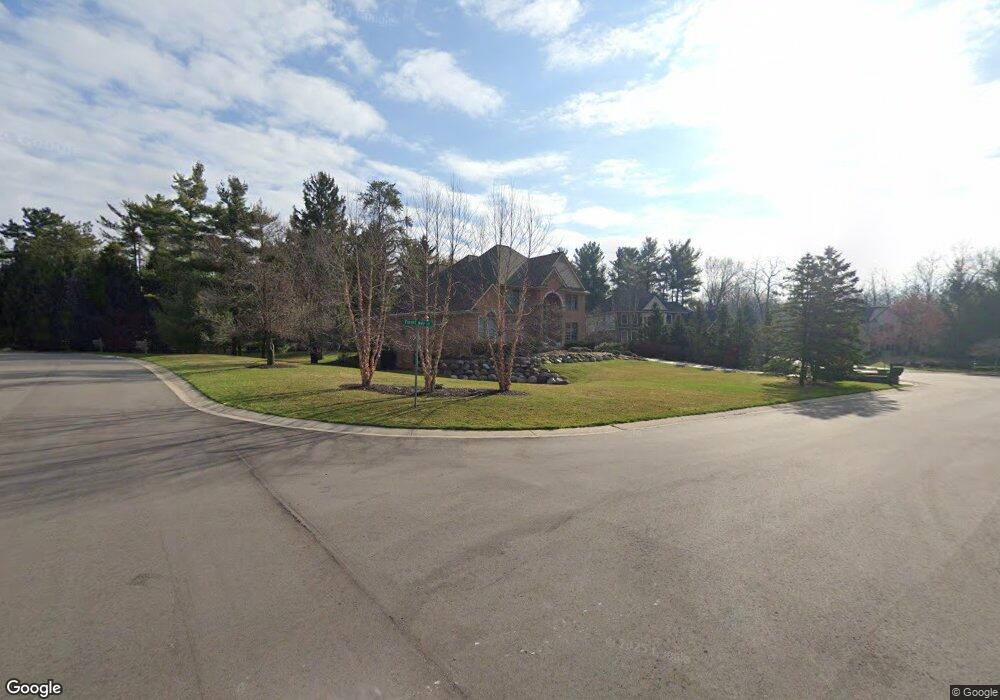
7253 Forest Way Ct Brighton, MI 48116
Estimated Value: $770,221 - $1,239,000
5
Beds
4
Baths
3,016
Sq Ft
$344/Sq Ft
Est. Value
About This Home
This home is located at 7253 Forest Way Ct, Brighton, MI 48116 and is currently estimated at $1,037,305, approximately $343 per square foot. 7253 Forest Way Ct is a home located in Livingston County with nearby schools including Hornung Elementary School, Scranton Middle School, and Brighton High School.
Ownership History
Date
Name
Owned For
Owner Type
Purchase Details
Closed on
Aug 22, 2025
Current Estimated Value
Purchase Details
Closed on
May 27, 2011
Home Financials for this Owner
Home Financials are based on the most recent Mortgage that was taken out on this home.
Original Mortgage
$327,200
Interest Rate
4.8%
Mortgage Type
Purchase Money Mortgage
Purchase Details
Closed on
Mar 16, 2011
Purchase Details
Closed on
Feb 10, 2011
Sold by
Jcm Services Llc
Purchase Details
Closed on
Jan 26, 2011
Bought by
Jcm Services Llc
Purchase Details
Closed on
Nov 22, 2002
Create a Home Valuation Report for This Property
The Home Valuation Report is an in-depth analysis detailing your home's value as well as a comparison with similar homes in the area
Home Values in the Area
Average Home Value in this Area
Purchase History
| Date | Buyer | Sale Price | Title Company |
|---|---|---|---|
| -- | -- | None Listed On Document | |
| -- | $409,000 | -- | |
| -- | $245,900 | -- | |
| -- | -- | -- | |
| Jcm Services Llc | -- | -- | |
| -- | $116,900 | Metropolitan Title Co |
Source: Public Records
Mortgage History
| Date | Status | Borrower | Loan Amount |
|---|---|---|---|
| Previous Owner | -- | $327,200 |
Source: Public Records
Tax History
| Year | Tax Paid | Tax Assessment Tax Assessment Total Assessment is a certain percentage of the fair market value that is determined by local assessors to be the total taxable value of land and additions on the property. | Land | Improvement |
|---|---|---|---|---|
| 2025 | $3,963 | $398,700 | $0 | $0 |
| 2024 | $3,852 | $378,800 | $0 | $0 |
| 2023 | $3,681 | $363,100 | $0 | $0 |
| 2022 | $6,458 | $269,600 | $0 | $0 |
| 2021 | $6,195 | $289,700 | $0 | $0 |
| 2020 | $6,285 | $284,700 | $0 | $0 |
| 2019 | $6,191 | $269,600 | $0 | $0 |
| 2018 | $5,838 | $265,200 | $0 | $0 |
| 2017 | $5,726 | $265,200 | $0 | $0 |
| 2016 | $5,710 | $261,100 | $0 | $0 |
| 2014 | $5,045 | $237,300 | $0 | $0 |
| 2012 | $5,045 | $219,000 | $0 | $0 |
Source: Public Records
Map
Nearby Homes
- Lot 242-243 Hartford Way
- 5392 Hidden Pines Dr
- 55 Wyndam Ln
- 5350 Hidden Pines Dr
- 53 Pinemont Dr
- 58 Wyndam Ln
- 15 Wyndam Ln
- 5972 Wyndam Ln
- 5876 Wyndam Ln
- 6060 Pinemont Dr
- 36 Pinemont Dr
- 21 Rexford Ct
- 5306 Hidden Pines Ct
- 32 Pinemont Dr
- 31 Pinemont Dr
- 24 Rexford Ct
- 44 Pinemont Dr
- 25 Rexford Ct
- 43 Pinemont Dr
- 41 Pinemont Dr
- 7125 Forest Way Ct
- 5631 River Ridge Dr
- 7200 River Ridge Ct
- 7232 Forest Way Dr
- 7143 Forest Way Ct
- 7232 Forest Way
- 7256 Forest Way
- 7100 Forest Way Ct
- 7220 River Ridge Ct
- 7280 Forest Way
- 7204 Forest Way
- 7136 Forest Way Ct
- 7118 Forest Way Ct
- 7304 Forest Way
- 7215 River Ridge Ct
- 5632 River Ridge Dr
- 7176 Forest Way
- 7326 Forest Way
- 7203 River Ridge Ct Unit Bldg-Unit
- 5610 River Ridge Dr
Your Personal Tour Guide
Ask me questions while you tour the home.