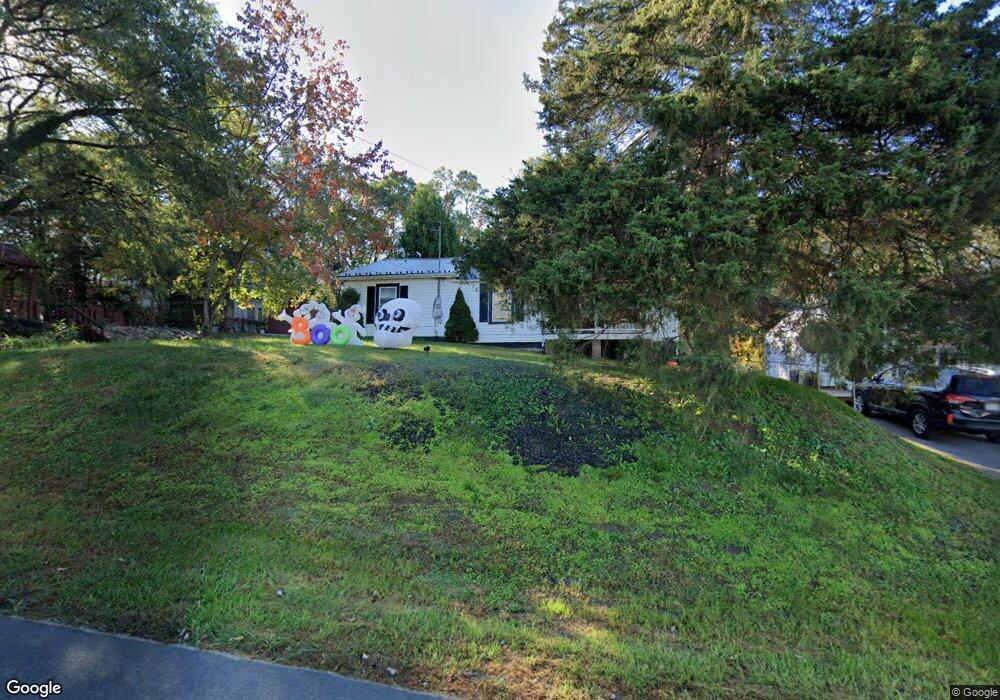
726 4th St NE Pulaski, VA 24301
Estimated Value: $140,484 - $159,000
2
Beds
2
Baths
1,128
Sq Ft
$129/Sq Ft
Est. Value
About This Home
This home is located at 726 4th St NE, Pulaski, VA 24301 and is currently estimated at $145,871, approximately $129 per square foot. 726 4th St NE is a home located in Pulaski County with nearby schools including Pulaski Elementary School, Pulaski County High School, and Mayflower Christian Academy.
Ownership History
Date
Name
Owned For
Owner Type
Purchase Details
Closed on
Jun 11, 2009
Sold by
Citifinancial Inc
Bought by
Cooper Thomas B
Current Estimated Value
Home Financials for this Owner
Home Financials are based on the most recent Mortgage that was taken out on this home.
Original Mortgage
$29,600
Outstanding Balance
$18,752
Interest Rate
4.82%
Mortgage Type
New Conventional
Estimated Equity
$127,119
Purchase Details
Closed on
Mar 24, 2009
Sold by
Glasser And Glasser Plc and Sutphin Linda S
Bought by
Citifinancial Inc
Create a Home Valuation Report for This Property
The Home Valuation Report is an in-depth analysis detailing your home's value as well as a comparison with similar homes in the area
Home Values in the Area
Average Home Value in this Area
Purchase History
| Date | Buyer | Sale Price | Title Company |
|---|---|---|---|
| Cooper Thomas B | $37,000 | -- | |
| Citifinancial Inc | $26,299 | -- |
Source: Public Records
Mortgage History
| Date | Status | Borrower | Loan Amount |
|---|---|---|---|
| Open | Citifinancial Inc | $29,600 |
Source: Public Records
Tax History
| Year | Tax Paid | Tax Assessment Tax Assessment Total Assessment is a certain percentage of the fair market value that is determined by local assessors to be the total taxable value of land and additions on the property. | Land | Improvement |
|---|---|---|---|---|
| 2025 | $637 | $86,100 | $6,500 | $79,600 |
| 2024 | $637 | $86,100 | $6,500 | $79,600 |
| 2023 | $637 | $86,100 | $6,500 | $79,600 |
| 2022 | $637 | $86,100 | $6,500 | $79,600 |
| 2021 | $637 | $86,100 | $6,500 | $79,600 |
| 2020 | $540 | $70,100 | $4,500 | $65,600 |
| 2019 | $540 | $70,100 | $4,500 | $65,600 |
| 2018 | $540 | $70,100 | $4,500 | $65,600 |
| 2017 | $449 | $70,100 | $4,500 | $65,600 |
| 2016 | $449 | $70,100 | $4,500 | $65,600 |
| 2015 | $449 | $70,100 | $4,500 | $65,600 |
| 2014 | $399 | $67,700 | $4,500 | $63,200 |
| 2013 | $399 | $67,700 | $4,500 | $63,200 |
Source: Public Records
Map
Nearby Homes
- 639 5th St NE
- 849 Pepper St
- 956 Ward Ln
- 715 Franklin Ave
- 745 Peppers Ferry Rd
- 713 Peppers Ferry Rd
- 903 Mashburn Ave
- 840 Newbern Rd
- 876 Dillon St
- 554 Monroe Ave
- TBD Herron St
- 118 6th St NE
- 601 Orchard Rd
- 1224 Macgill St
- 1217 Newbern Rd
- 516 Jackson Ave
- 151 Tower St
- 634 Prospect Ave
- 1009 5th St SE
- 913 Oakhurst Ave
Your Personal Tour Guide
Ask me questions while you tour the home.