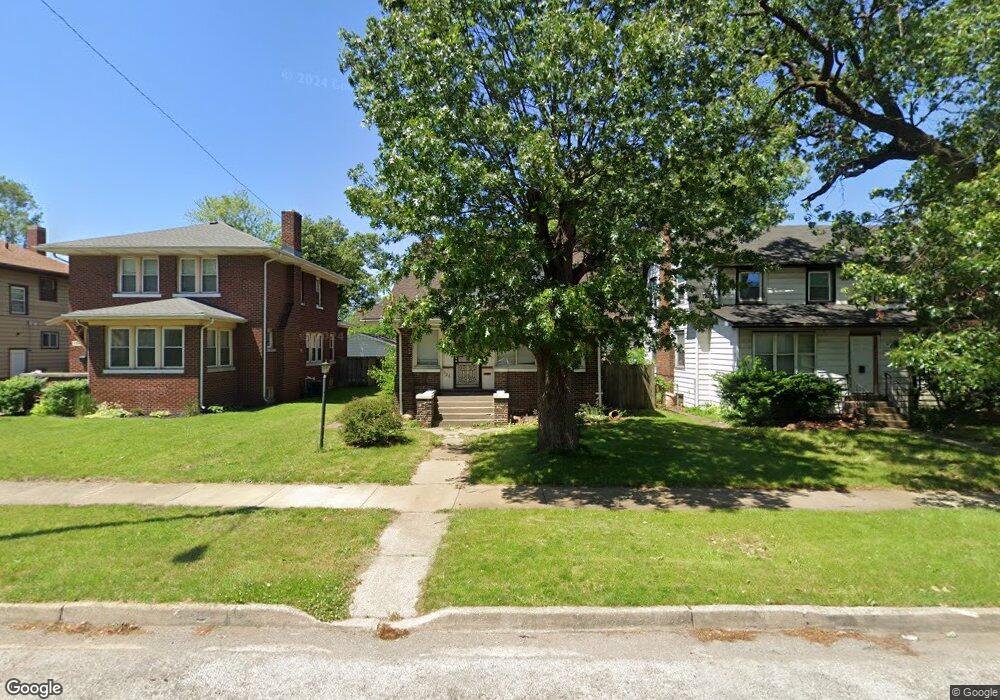
726 Pierce St Gary, IN 46402
Downtown Gary NeighborhoodEstimated Value: $84,000 - $201,000
4
Beds
1
Bath
926
Sq Ft
$153/Sq Ft
Est. Value
About This Home
This home is located at 726 Pierce St, Gary, IN 46402 and is currently estimated at $141,990, approximately $153 per square foot. 726 Pierce St is a home located in Lake County with nearby schools including Beveridge Elementary School, Gary Middle School, and West Side Leadership Academy.
Ownership History
Date
Name
Owned For
Owner Type
Purchase Details
Closed on
Nov 29, 2005
Sold by
Cavender Properties Llc
Bought by
Strickland Sana M
Current Estimated Value
Home Financials for this Owner
Home Financials are based on the most recent Mortgage that was taken out on this home.
Original Mortgage
$81,000
Outstanding Balance
$52,953
Interest Rate
9.75%
Mortgage Type
Fannie Mae Freddie Mac
Estimated Equity
$89,037
Purchase Details
Closed on
Apr 12, 2005
Sold by
Fifth Third Bank
Bought by
Cavender Properties Llc
Create a Home Valuation Report for This Property
The Home Valuation Report is an in-depth analysis detailing your home's value as well as a comparison with similar homes in the area
Home Values in the Area
Average Home Value in this Area
Purchase History
We collect this data history from publicly available records. To have your information removed, we recommend requesting removal directly through your county’s website.
| Date | Buyer | Sale Price | Title Company |
|---|---|---|---|
| Strickland Sana M | -- | Chicago Title Insurance Comp | |
| Cavender Properties Llc | -- | Royal Title Services |
Source: Public Records
Mortgage History
We collect this data history from publicly available records. To have your information removed, we recommend requesting removal directly through your county’s website.
| Date | Status | Borrower | Loan Amount |
|---|---|---|---|
| Open | Strickland Sana M | $81,000 |
Source: Public Records
Tax History
| Year | Tax Paid | Tax Assessment Tax Assessment Total Assessment is a certain percentage of the fair market value that is determined by local assessors to be the total taxable value of land and additions on the property. | Land | Improvement |
|---|---|---|---|---|
| 2025 | $2,045 | $79,600 | $7,300 | $72,300 |
| 2024 | $6,939 | $72,500 | $7,300 | $65,200 |
| 2023 | $908 | $78,700 | $7,100 | $71,600 |
| 2022 | $908 | $79,800 | $4,500 | $75,300 |
| 2021 | $829 | $73,800 | $4,500 | $69,300 |
| 2020 | $820 | $73,000 | $4,500 | $68,500 |
| 2019 | $752 | $69,200 | $4,500 | $64,700 |
| 2018 | $729 | $65,200 | $4,300 | $60,900 |
| 2017 | $744 | $66,100 | $4,300 | $61,800 |
| 2016 | $769 | $68,900 | $4,300 | $64,600 |
| 2014 | $906 | $83,200 | $5,300 | $77,900 |
| 2013 | $866 | $81,500 | $5,300 | $76,200 |
Source: Public Records
Map
Nearby Homes
- 743 Buchanan St
- 763 Pierce St
- 733 Lincoln St
- 805 Buchanan St
- 809 Pierce St
- 755 Johnson St
- 600 Pierce St
- 833 Fillmore St
- 829 Johnson St
- 824 Johnson St
- 701 Tyler St
- 568 Johnson St
- 747 Van Buren St
- 434 Pierce St
- 1113 W 11th Ave
- 1148 Pierce St
- 1141 Fillmore St
- 565 Jackson St
- 1695 W 10th Ave
- 329 Pierce St
Your Personal Tour Guide
Ask me questions while you tour the home.