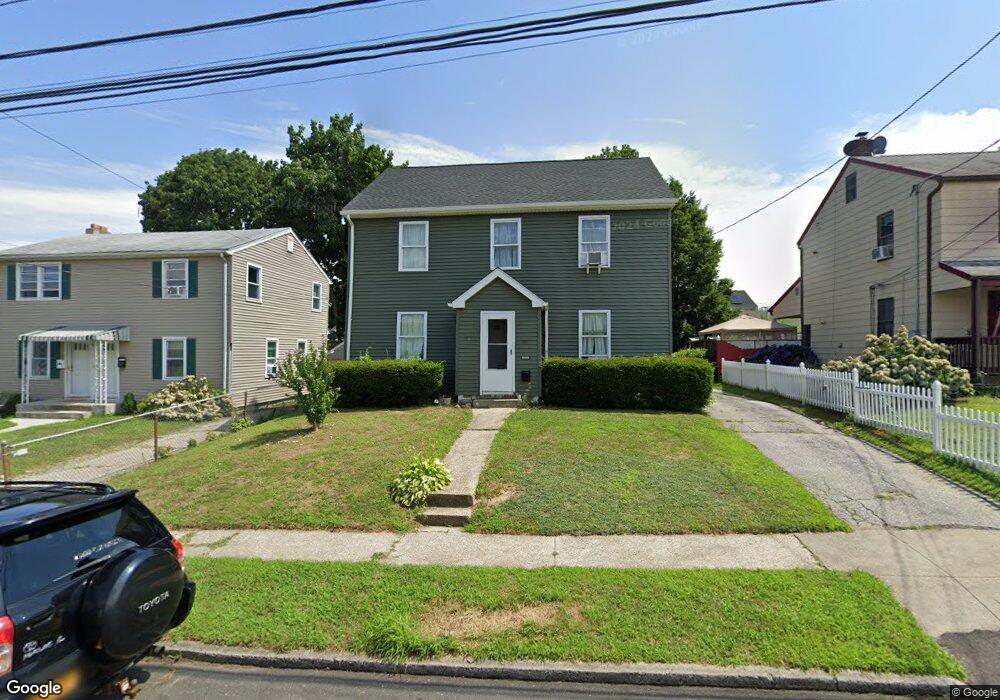
729 Queen St Bridgeport, CT 06606
North End NeighborhoodEstimated Value: $373,000 - $470,000
3
Beds
2
Baths
1,488
Sq Ft
$291/Sq Ft
Est. Value
About This Home
This home is located at 729 Queen St, Bridgeport, CT 06606 and is currently estimated at $432,355, approximately $290 per square foot. 729 Queen St is a home located in Fairfield County with nearby schools including Blackham School, Central High School, and The Unquowa School.
Ownership History
Date
Name
Owned For
Owner Type
Purchase Details
Closed on
Jul 29, 1994
Sold by
Coulsey Thomas Est
Bought by
Clements Sheila L
Current Estimated Value
Create a Home Valuation Report for This Property
The Home Valuation Report is an in-depth analysis detailing your home's value as well as a comparison with similar homes in the area
Home Values in the Area
Average Home Value in this Area
Purchase History
We collect this data history from publicly available records. To have your information removed, we recommend requesting removal directly through your county’s website.
| Date | Buyer | Sale Price | Title Company |
|---|---|---|---|
| Clements Sheila L | $63,000 | -- | |
| Clements Sheila L | $63,000 | -- |
Source: Public Records
Mortgage History
We collect this data history from publicly available records. To have your information removed, we recommend requesting removal directly through your county’s website.
| Date | Status | Borrower | Loan Amount |
|---|---|---|---|
| Closed | Clements Sheila L | $25,000 | |
| Open | Clements Sheila L | $152,000 | |
| Closed | Clements Sheila L | $102,000 | |
| Closed | Clements Sheila L | $16,000 |
Source: Public Records
Tax History
| Year | Tax Paid | Tax Assessment Tax Assessment Total Assessment is a certain percentage of the fair market value that is determined by local assessors to be the total taxable value of land and additions on the property. | Land | Improvement |
|---|---|---|---|---|
| 2025 | $7,794 | $179,370 | $75,310 | $104,060 |
| 2024 | $7,794 | $179,370 | $75,310 | $104,060 |
| 2023 | $7,794 | $179,370 | $75,310 | $104,060 |
| 2022 | $7,794 | $179,370 | $75,310 | $104,060 |
| 2021 | $7,794 | $179,370 | $75,310 | $104,060 |
| 2020 | $9,532 | $176,560 | $43,270 | $133,290 |
| 2019 | $6,194 | $114,720 | $43,270 | $71,450 |
| 2018 | $4,171 | $76,710 | $43,270 | $33,440 |
| 2017 | $4,227 | $77,750 | $43,270 | $34,480 |
| 2016 | $4,227 | $77,750 | $43,270 | $34,480 |
| 2015 | $4,201 | $99,560 | $49,980 | $49,580 |
| 2014 | $4,201 | $99,560 | $49,980 | $49,580 |
Source: Public Records
Map
Nearby Homes
- 669 Queen St
- 646 Merritt St
- 855 Burnsford Ave
- 900 Merritt St
- 838 Ruth St
- 27 Plateau Ave
- 149 Ashton St
- 520 Goldenrod Ave
- 375 Ruth St
- 300 Birmingham St
- 415 Jewett Ave
- 462 Glendale Ave Unit 11
- 78 Rena Place
- 286 Ruth St
- 56 Peet St
- 3845 Park Ave Unit 18
- 255 Ruth St
- 557 Glendale Ave
- 403 Clark St
- 337 Jewett Ave
Your Personal Tour Guide
Ask me questions while you tour the home.