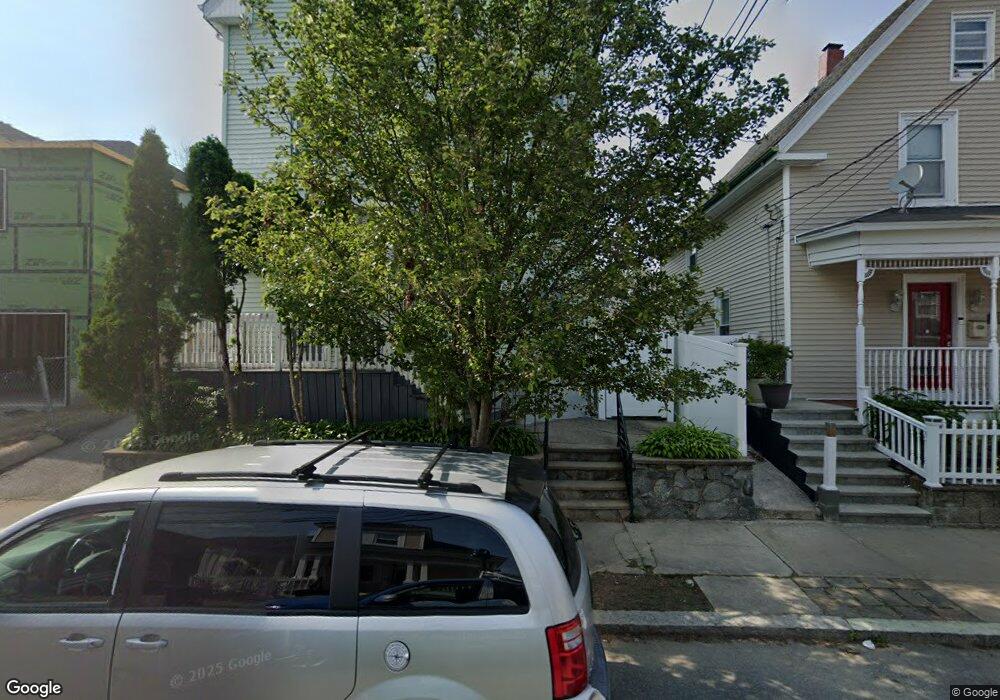
73 Calla St Providence, RI 02905
Washington Park NeighborhoodEstimated Value: $515,402 - $578,000
About This Home
This home is located at 73 Calla St, Providence, RI 02905 and is currently estimated at $549,101, approximately $211 per square foot. 73 Calla St is a home located in Providence County with nearby schools including Asa Messer Elementary School, Robert L. Bailey IV Elementary, and Alfred Lima Sr. Elementary School.
Ownership History
We collect this data history from publicly available records. To have your information removed, we recommend requesting removal directly through your county’s website.
Purchase Details
Home Values in the Area
Average Home Value in this Area
Purchase History
We collect this data history from publicly available records. To have your information removed, we recommend requesting removal directly through your county’s website.
| Date | Buyer | Sale Price | Title Company |
|---|---|---|---|
| $67,900 | -- |
Mortgage History
We collect this data history from publicly available records. To have your information removed, we recommend requesting removal directly through your county’s website.
| Date | Status | Borrower | Loan Amount |
|---|---|---|---|
| Previous Owner | $215,503 | ||
| Previous Owner | $215,501 | ||
| Previous Owner | $80,000 |
Tax History
We collect this data history from publicly available records. To have your information removed, we recommend requesting removal directly through your county’s website.
| Year | Tax Paid | Tax Assessment Tax Assessment Total Assessment is a certain percentage of the fair market value that is determined by local assessors to be the total taxable value of land and additions on the property. | Land | Improvement |
|---|---|---|---|---|
| 2025 | $3,396 | $449,800 | $118,800 | $331,000 |
| 2024 | $5,716 | $311,500 | $75,300 | $236,200 |
| 2023 | $5,716 | $311,500 | $75,300 | $236,200 |
| 2022 | $5,545 | $311,500 | $75,300 | $236,200 |
| 2021 | $4,278 | $174,200 | $33,200 | $141,000 |
| 2020 | $4,278 | $174,200 | $33,200 | $141,000 |
| 2019 | $4,278 | $174,200 | $33,200 | $141,000 |
| 2018 | $3,714 | $116,200 | $30,200 | $86,000 |
| 2017 | $3,714 | $116,200 | $30,200 | $86,000 |
| 2016 | $3,714 | $116,200 | $30,200 | $86,000 |
| 2015 | $3,538 | $106,900 | $30,200 | $76,700 |
| 2014 | $3,608 | $106,900 | $30,200 | $76,700 |
| 2013 | $3,608 | $106,900 | $30,200 | $76,700 |
Map
- 78 Calla St
- 83 Homer St
- 16 Broom St
- 2 Parkview Ave
- 168 Calla St
- 139 Babcock St
- 304 Indiana Ave
- 374 New York Ave
- 126 Johnson St
- 291 California Ave
- 118 Porter St
- 297 Vermont Ave
- 255 Ohio Ave
- 272 Washington Ave
- 252 California Ave
- 273 Montgomery Ave
- 133 Byfield St
- 274 Montgomery Ave
- 207 California Ave
- 194 Pavilion Ave
Ask me questions while you tour the home.