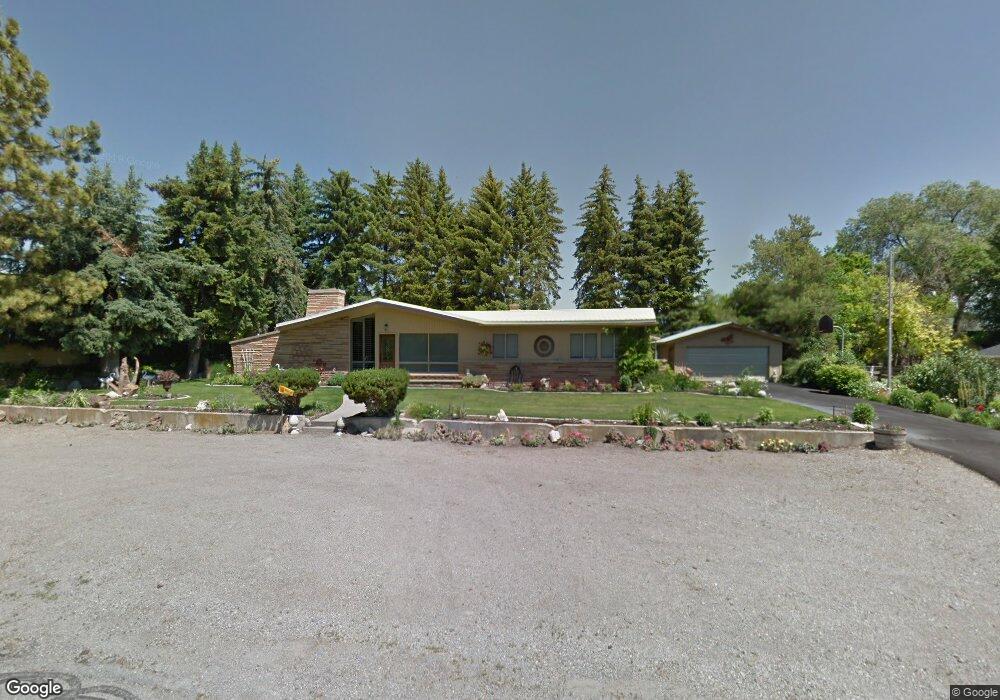
73 E 400 N Mendon, UT 84325
Estimated Value: $528,000 - $649,000
Studio
--
Bath
1,588
Sq Ft
$372/Sq Ft
Est. Value
About This Home
This home is located at 73 E 400 N, Mendon, UT 84325 and is currently estimated at $591,184, approximately $372 per square foot. 73 E 400 N is a home with nearby schools including Mountainside School, South Cache Middle School, and Mountain Crest High School.
Ownership History
Date
Name
Owned For
Owner Type
Purchase Details
Closed on
Apr 24, 2020
Sold by
Maurer Shelley and Krambule Michael
Bought by
Donnell Channing S and Donnell Andylin C
Current Estimated Value
Home Financials for this Owner
Home Financials are based on the most recent Mortgage that was taken out on this home.
Original Mortgage
$261,182
Outstanding Balance
$231,314
Interest Rate
3.5%
Mortgage Type
FHA
Estimated Equity
$359,870
Purchase Details
Closed on
Jun 26, 2006
Sold by
Maurer Arthur Dean and Maurer Geraldine K
Bought by
Maurer Arthur Dean and Maurer Geraldine K
Create a Home Valuation Report for This Property
The Home Valuation Report is an in-depth analysis detailing your home's value as well as a comparison with similar homes in the area
Purchase History
| Date | Buyer | Sale Price | Title Company |
|---|---|---|---|
| Donnell Channing S | -- | Advanced Title | |
| Maurer Arthur Dean | -- | None Available |
Source: Public Records
Mortgage History
| Date | Status | Borrower | Loan Amount |
|---|---|---|---|
| Open | Donnell Channing S | $261,182 |
Source: Public Records
Tax History
| Year | Tax Paid | Tax Assessment Tax Assessment Total Assessment is a certain percentage of the fair market value that is determined by local assessors to be the total taxable value of land and additions on the property. | Land | Improvement |
|---|---|---|---|---|
| 2025 | $2,252 | $298,000 | $0 | $0 |
| 2024 | $2,403 | $298,000 | $0 | $0 |
| 2023 | $2,345 | $276,255 | $0 | $0 |
| 2022 | $2,361 | $276,250 | $0 | $0 |
| 2021 | $1,908 | $335,430 | $61,000 | $274,430 |
| 2020 | $1,673 | $272,100 | $61,000 | $211,100 |
| 2019 | $1,763 | $272,100 | $61,000 | $211,100 |
| 2018 | $1,298 | $199,544 | $61,000 | $138,544 |
| 2017 | $1,260 | $101,585 | $0 | $0 |
| 2016 | $1,246 | $94,575 | $0 | $0 |
| 2015 | $1,169 | $94,575 | $0 | $0 |
| 2014 | $1,141 | $94,575 | $0 | $0 |
| 2013 | -- | $88,975 | $0 | $0 |
Source: Public Records
Map
Nearby Homes
- 54 W 200 N
- 2500 S 6400 W
- 18 E 300 S
- 1811 S 5900 W
- 6770 W 400 S
- 876 N 75 W Unit 9
- 967 N 75 W Unit 63
- 59 W 1050 N Unit 18
- 993 N 75 W Unit 64
- 948 N 75 W Unit 11
- 42 W 850 N Unit 5
- 1044 N 75 W Unit 15
- 850 N 51 W Unit 59
- 74 W 850 N Unit 7
- 915 N 75 W Unit 61
- 850 N 73 W Unit 60
- 26 W 850 N Unit 4
- 1045 N 75 W Unit 66
- 1052 N 75 W Unit 16
- 996 N 75 W Unit 13
Your Personal Tour Guide
Ask me questions while you tour the home.