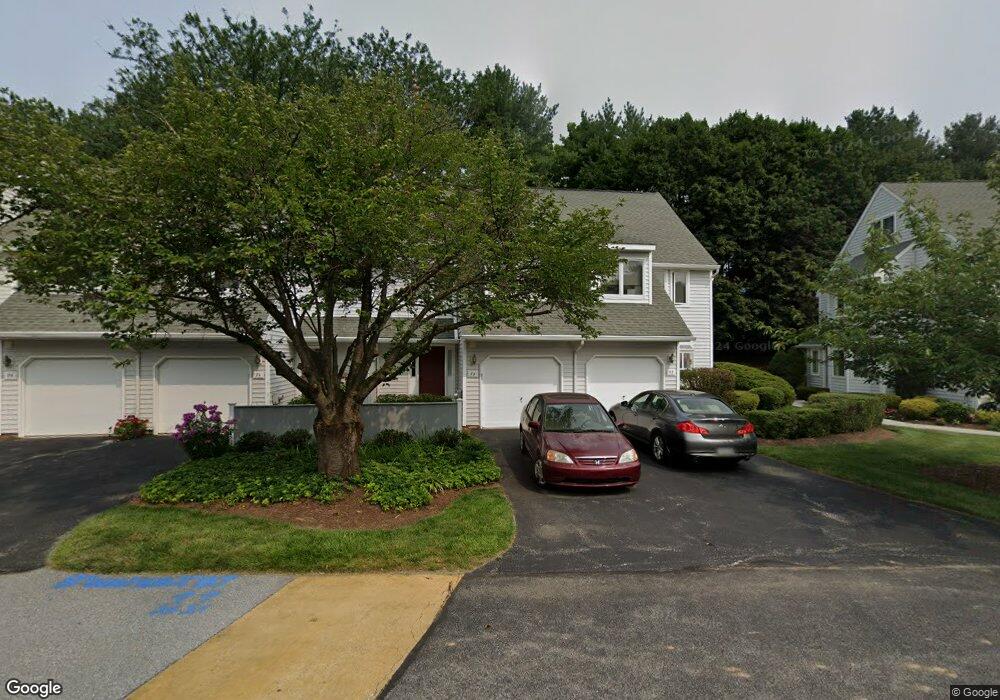
73 E Jonathan Ct Kennett Square, PA 19348
East Marlborough NeighborhoodEstimated Value: $346,000 - $381,000
3
Beds
3
Baths
1,418
Sq Ft
$253/Sq Ft
Est. Value
About This Home
This home is located at 73 E Jonathan Ct, Kennett Square, PA 19348 and is currently estimated at $359,157, approximately $253 per square foot. 73 E Jonathan Ct is a home located in Chester County with nearby schools including Kennett Middle School, Kennett High School, and St. Patrick School.
Ownership History
Date
Name
Owned For
Owner Type
Purchase Details
Closed on
Aug 26, 2011
Sold by
Wazeter Linda L
Bought by
Kukulski Frank C and Oneill Kukulski Sharon L
Current Estimated Value
Home Financials for this Owner
Home Financials are based on the most recent Mortgage that was taken out on this home.
Original Mortgage
$124,800
Outstanding Balance
$86,557
Interest Rate
4.53%
Mortgage Type
New Conventional
Estimated Equity
$272,600
Purchase Details
Closed on
Jun 14, 2002
Sold by
Hyman Sallie
Bought by
Wazeter Linda L
Home Financials for this Owner
Home Financials are based on the most recent Mortgage that was taken out on this home.
Original Mortgage
$100,000
Interest Rate
6.92%
Purchase Details
Closed on
Jul 21, 1999
Sold by
Amos Alvin E
Bought by
Hyman Sallie
Home Financials for this Owner
Home Financials are based on the most recent Mortgage that was taken out on this home.
Original Mortgage
$80,000
Interest Rate
7.61%
Create a Home Valuation Report for This Property
The Home Valuation Report is an in-depth analysis detailing your home's value as well as a comparison with similar homes in the area
Home Values in the Area
Average Home Value in this Area
Purchase History
| Date | Buyer | Sale Price | Title Company |
|---|---|---|---|
| Kukulski Frank C | $156,000 | None Available | |
| Wazeter Linda L | $135,000 | -- | |
| Hyman Sallie | $102,000 | -- |
Source: Public Records
Mortgage History
| Date | Status | Borrower | Loan Amount |
|---|---|---|---|
| Open | Kukulski Frank C | $124,800 | |
| Previous Owner | Wazeter Linda L | $100,000 | |
| Previous Owner | Hyman Sallie | $80,000 |
Source: Public Records
Tax History
| Year | Tax Paid | Tax Assessment Tax Assessment Total Assessment is a certain percentage of the fair market value that is determined by local assessors to be the total taxable value of land and additions on the property. | Land | Improvement |
|---|---|---|---|---|
| 2025 | $695 | $103,270 | $23,660 | $79,610 |
| 2024 | $695 | $103,270 | $23,660 | $79,610 |
| 2023 | $695 | $103,270 | $23,660 | $79,610 |
| 2022 | $578 | $103,270 | $23,660 | $79,610 |
| 2021 | $695 | $103,270 | $23,660 | $79,610 |
| 2020 | $560 | $103,270 | $23,660 | $79,610 |
| 2019 | $677 | $103,270 | $23,660 | $79,610 |
| 2018 | $677 | $103,270 | $23,660 | $79,610 |
| 2017 | $677 | $103,270 | $23,660 | $79,610 |
| 2016 | $409 | $103,270 | $23,660 | $79,610 |
| 2015 | $409 | $103,270 | $23,660 | $79,610 |
| 2014 | $409 | $103,270 | $23,660 | $79,610 |
Source: Public Records
Map
Nearby Homes
- 39 E Jonathan Ct
- 296 Deepdale Dr
- 178 S Orchard Ave
- 123 Federal Walk
- 962 E Baltimore Pike
- 316 Maple Dr
- 400 Lantern Ln
- 403 Winterberry Dr Unit 42
- 323 Cherry Ln
- 808 Fountain Trail
- 989 Sills Mill Rd
- 327 E Street Rd
- 932 Ayla Ln Unit 26
- 712 Wickersham Ln
- 103 Pierce Ln
- 211 Daylesford Ct
- 10103 Beacon St
- 111 Waywood Dr Unit 33
- 113 Waywood Dr Unit 32
- 115 Waywood Dr Unit 31
- 72 E Jonathan Ct
- 74 E Jonathan Ct
- 75 E Jonathan Ct
- 76 E Jonathan Ct
- 71 E Jonathan Ct
- 77 E Jonathan Ct
- 70 E Jonathan Ct
- 69 E Jonathan Ct
- 37 E Jonathan Ct Unit 37
- 68 E Jonathan Ct
- 38 E Jonathan Ct
- 36 S Orchard Ave
- 67 E Jonathan Ct
- 35 S Orchard Ave Unit 35
- 41 E Jonathan Ct
- 66 E Jonathan Ct
- 928 E Baltimore Pike
- 34 S Orchard Ave
- 33 S Orchard Ave
- 42 E Jonathan Ct
Your Personal Tour Guide
Ask me questions while you tour the home.