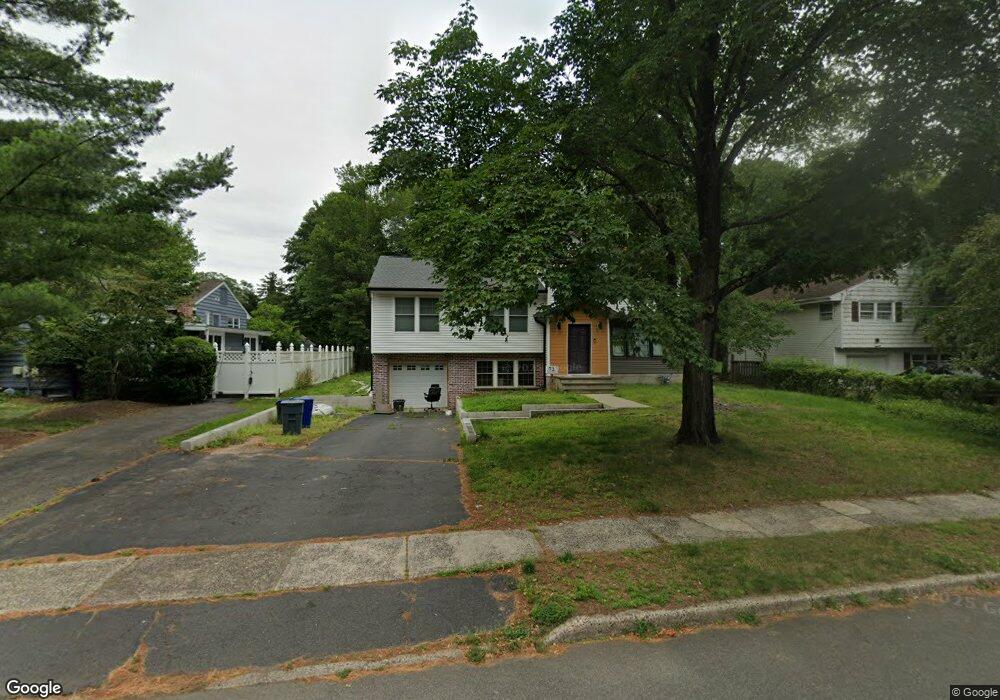
73 Maple Ave Closter, NJ 07624
Estimated Value: $1,006,997 - $1,347,000
Studio
--
Bath
2,473
Sq Ft
$455/Sq Ft
Est. Value
About This Home
This home is located at 73 Maple Ave, Closter, NJ 07624 and is currently estimated at $1,125,999, approximately $455 per square foot. 73 Maple Ave is a home located in Bergen County with nearby schools including Hillside Elementary School, Tenakill Middle School, and Northern Valley Regional High School at Demarest.
Ownership History
Date
Name
Owned For
Owner Type
Purchase Details
Closed on
Jan 29, 2021
Sold by
Tono Ted A
Bought by
Beddoe Robert E and Beyruti Amina D
Current Estimated Value
Home Financials for this Owner
Home Financials are based on the most recent Mortgage that was taken out on this home.
Original Mortgage
$378,000
Interest Rate
2.6%
Mortgage Type
New Conventional
Purchase Details
Closed on
Jul 20, 2000
Bought by
Tono Ted A
Home Financials for this Owner
Home Financials are based on the most recent Mortgage that was taken out on this home.
Original Mortgage
$75,000
Interest Rate
8.07%
Create a Home Valuation Report for This Property
The Home Valuation Report is an in-depth analysis detailing your home's value as well as a comparison with similar homes in the area
Home Values in the Area
Average Home Value in this Area
Purchase History
| Date | Buyer | Sale Price | Title Company |
|---|---|---|---|
| Beddoe Robert E | $420,000 | Grandview Ttl Agcy Of Bergen | |
| Tono Ted A | -- | -- | |
| Tono Ted A | -- | -- |
Source: Public Records
Mortgage History
| Date | Status | Borrower | Loan Amount |
|---|---|---|---|
| Previous Owner | Beddoe Robert E | $378,000 | |
| Previous Owner | Tono Ted A | $75,000 |
Source: Public Records
Tax History
| Year | Tax Paid | Tax Assessment Tax Assessment Total Assessment is a certain percentage of the fair market value that is determined by local assessors to be the total taxable value of land and additions on the property. | Land | Improvement |
|---|---|---|---|---|
| 2025 | $17,205 | $914,000 | $495,000 | $419,000 |
| 2024 | $12,047 | $813,100 | $415,200 | $397,900 |
| 2023 | $11,248 | $561,900 | $368,200 | $193,700 |
| 2022 | $11,248 | $508,500 | $324,000 | $184,500 |
| 2021 | $10,234 | $465,900 | $312,100 | $153,800 |
| 2020 | $10,510 | $469,000 | $314,000 | $155,000 |
| 2019 | $10,249 | $462,300 | $309,700 | $152,600 |
| 2018 | $10,082 | $452,900 | $302,600 | $150,300 |
| 2017 | $10,915 | $478,300 | $287,900 | $190,400 |
| 2016 | $10,709 | $478,300 | $287,900 | $190,400 |
| 2015 | $9,975 | $478,300 | $287,900 | $190,400 |
| 2014 | $9,683 | $478,300 | $287,900 | $190,400 |
Source: Public Records
Map
Nearby Homes
- 543 Closter Dock Rd
- 14 O Shaughnessy Ln
- 589 Piermont Rd
- 40 County Rd
- 353 Homans Ave
- 41 Orchard Rd
- 8 Ranch Ln
- 22 Northwood Ave
- 22 Maplewood Rd
- 504 High St
- 16 Poplar Rd
- 351 Closter Dock Rd
- 3 Central Ave
- 7 Central Ave
- 19 Central Ave
- 91 Macarthur Ave
- 56 Arnold Ave
- 520 Homans Ave
- 232 County Rd
- 11 Stone Bridge Ct
Your Personal Tour Guide
Ask me questions while you tour the home.