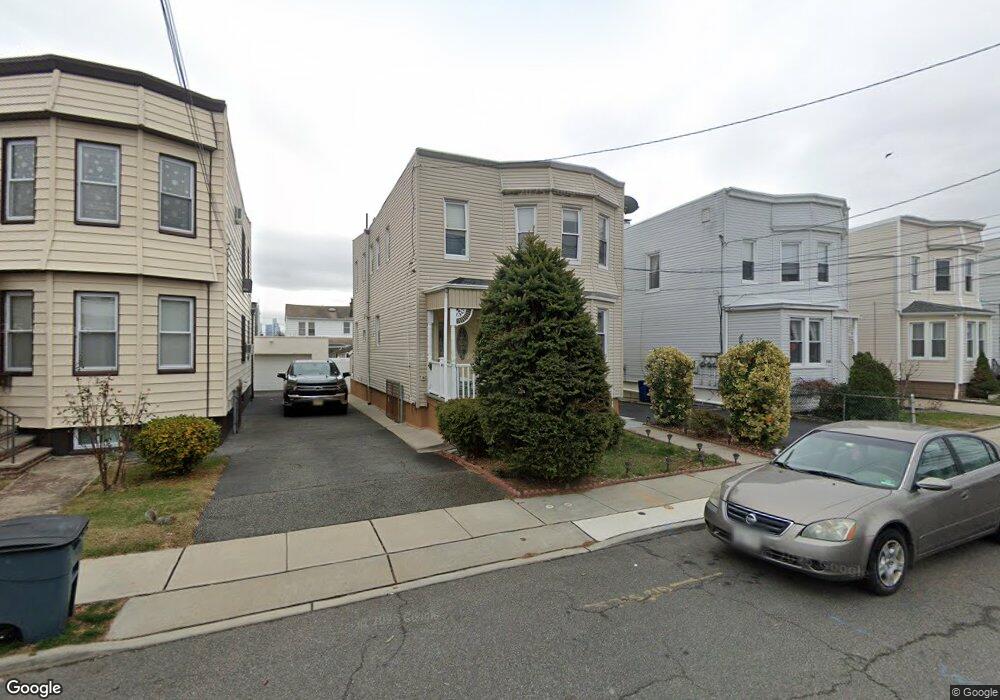
730 5th St Unit 2 Secaucus, NJ 07094
Estimated Value: $650,032 - $933,000
2
Beds
1
Bath
750
Sq Ft
$1,032/Sq Ft
Est. Value
About This Home
This home is located at 730 5th St Unit 2, Secaucus, NJ 07094 and is currently estimated at $774,008, approximately $1,032 per square foot. 730 5th St Unit 2 is a home located in Hudson County with nearby schools including Secaucus High School.
Ownership History
Date
Name
Owned For
Owner Type
Purchase Details
Closed on
Jan 22, 2004
Sold by
Gregorio Frank and Botros Wagieh
Bought by
Yang Catherine G
Current Estimated Value
Home Financials for this Owner
Home Financials are based on the most recent Mortgage that was taken out on this home.
Original Mortgage
$322,700
Interest Rate
5.62%
Mortgage Type
Stand Alone First
Purchase Details
Closed on
Aug 14, 2003
Sold by
Lew Robert and Lew Mary
Bought by
Gregorio Frank and Botros Wagieh
Create a Home Valuation Report for This Property
The Home Valuation Report is an in-depth analysis detailing your home's value as well as a comparison with similar homes in the area
Home Values in the Area
Average Home Value in this Area
Purchase History
| Date | Buyer | Sale Price | Title Company |
|---|---|---|---|
| Yang Catherine G | $439,000 | Fidelity National Title Insu | |
| Gregorio Frank | $275,000 | Multiple |
Source: Public Records
Mortgage History
| Date | Status | Borrower | Loan Amount |
|---|---|---|---|
| Previous Owner | Yang Catherine G | $322,700 |
Source: Public Records
Tax History
| Year | Tax Paid | Tax Assessment Tax Assessment Total Assessment is a certain percentage of the fair market value that is determined by local assessors to be the total taxable value of land and additions on the property. | Land | Improvement |
|---|---|---|---|---|
| 2025 | $6,265 | $153,100 | $72,300 | $80,800 |
| 2024 | $6,077 | $153,100 | $72,300 | $80,800 |
| 2023 | $6,077 | $153,100 | $72,300 | $80,800 |
| 2022 | $5,761 | $153,100 | $72,300 | $80,800 |
| 2021 | $5,772 | $153,100 | $72,300 | $80,800 |
| 2020 | $5,720 | $153,100 | $72,300 | $80,800 |
| 2019 | $5,683 | $153,100 | $72,300 | $80,800 |
| 2018 | $5,527 | $153,100 | $72,300 | $80,800 |
| 2017 | $5,533 | $153,100 | $72,300 | $80,800 |
| 2016 | $5,675 | $153,100 | $72,300 | $80,800 |
| 2015 | $5,668 | $153,100 | $72,300 | $80,800 |
| 2014 | $5,766 | $153,100 | $72,300 | $80,800 |
Source: Public Records
Map
Nearby Homes
Your Personal Tour Guide
Ask me questions while you tour the home.