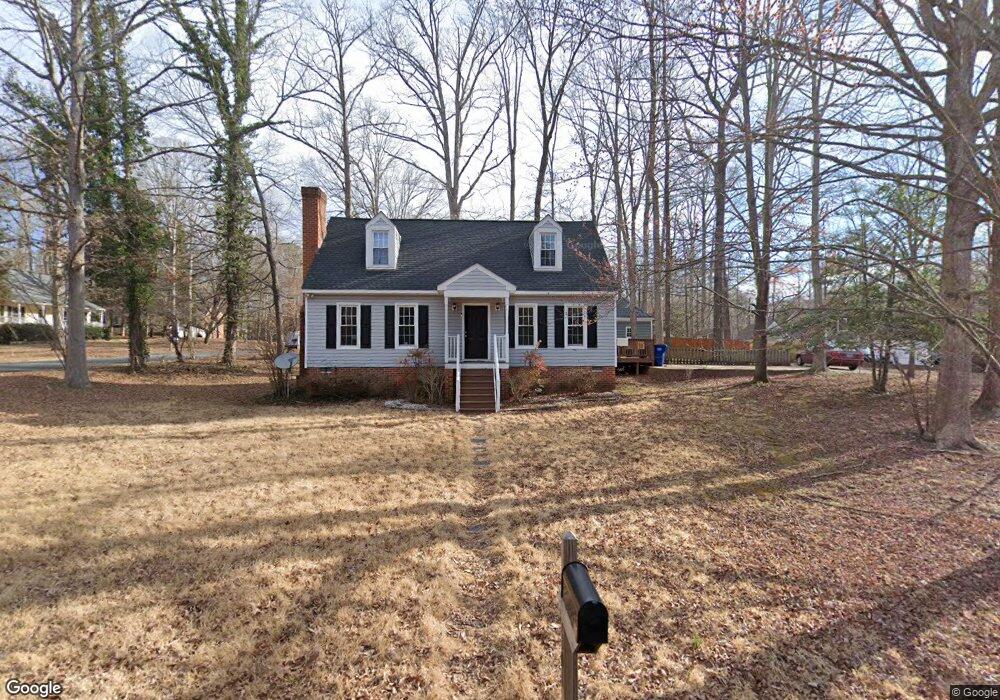
7301 Key Deer Ct Midlothian, VA 23112
Estimated Value: $362,411 - $369,000
3
Beds
2
Baths
1,675
Sq Ft
$218/Sq Ft
Est. Value
About This Home
This home is located at 7301 Key Deer Ct, Midlothian, VA 23112 and is currently estimated at $365,603, approximately $218 per square foot. 7301 Key Deer Ct is a home located in Chesterfield County with nearby schools including Alberta Smith Elementary School, Bailey Bridge Middle School, and Manchester High.
Ownership History
Date
Name
Owned For
Owner Type
Purchase Details
Closed on
Jan 31, 2022
Sold by
Lionheart Of Virginia Llc
Bought by
Baldwin Andrew
Current Estimated Value
Home Financials for this Owner
Home Financials are based on the most recent Mortgage that was taken out on this home.
Original Mortgage
$500,000
Outstanding Balance
$80,781
Interest Rate
3.56%
Mortgage Type
New Conventional
Estimated Equity
$284,822
Purchase Details
Closed on
Dec 28, 2015
Sold by
Equity Trustees Llc A Virginia Limited L
Bought by
Lionheart Of Virginia Llc A Virginia Lim
Purchase Details
Closed on
Apr 9, 2004
Sold by
Slaughter Michael
Bought by
Frasure Rodney
Home Financials for this Owner
Home Financials are based on the most recent Mortgage that was taken out on this home.
Original Mortgage
$136,087
Interest Rate
5.58%
Mortgage Type
Construction
Purchase Details
Closed on
Apr 27, 2001
Sold by
Jones Mary C
Bought by
Slaughter Michael D
Home Financials for this Owner
Home Financials are based on the most recent Mortgage that was taken out on this home.
Original Mortgage
$112,050
Interest Rate
6.88%
Mortgage Type
FHA
Create a Home Valuation Report for This Property
The Home Valuation Report is an in-depth analysis detailing your home's value as well as a comparison with similar homes in the area
Home Values in the Area
Average Home Value in this Area
Purchase History
We collect this data history from publicly available records. To have your information removed, we recommend requesting removal directly through your county’s website.
| Date | Buyer | Sale Price | Title Company |
|---|---|---|---|
| Baldwin Andrew | -- | None Listed On Document | |
| Baldwin Andrew | -- | None Listed On Document | |
| Lionheart Of Virginia Llc A Virginia Lim | $115,001 | None Available | |
| Frasure Rodney | $143,000 | -- | |
| Slaughter Michael D | $112,950 | -- |
Source: Public Records
Mortgage History
We collect this data history from publicly available records. To have your information removed, we recommend requesting removal directly through your county’s website.
| Date | Status | Borrower | Loan Amount |
|---|---|---|---|
| Open | Baldwin Andrew | $500,000 | |
| Closed | Baldwin Andrew | $500,000 | |
| Previous Owner | Frasure Rodney | $136,087 | |
| Previous Owner | Slaughter Michael D | $112,050 |
Source: Public Records
Tax History
| Year | Tax Paid | Tax Assessment Tax Assessment Total Assessment is a certain percentage of the fair market value that is determined by local assessors to be the total taxable value of land and additions on the property. | Land | Improvement |
|---|---|---|---|---|
| 2026 | $3,005 | $334,800 | $65,000 | $269,800 |
| 2025 | $3,005 | $324,100 | $62,000 | $262,100 |
| 2024 | $2,910 | $308,700 | $60,000 | $248,700 |
| 2023 | $2,604 | $286,100 | $57,000 | $229,100 |
| 2022 | $2,386 | $259,400 | $54,000 | $205,400 |
| 2021 | $2,202 | $224,800 | $52,000 | $172,800 |
| 2020 | $2,094 | $213,600 | $50,000 | $163,600 |
| 2019 | $1,910 | $201,100 | $48,000 | $153,100 |
| 2018 | $1,868 | $194,600 | $47,000 | $147,600 |
| 2017 | $1,837 | $186,100 | $44,000 | $142,100 |
| 2016 | $1,729 | $180,100 | $43,000 | $137,100 |
| 2015 | $1,657 | $170,000 | $42,000 | $128,000 |
| 2014 | $1,591 | $163,100 | $41,000 | $122,100 |
Source: Public Records
Map
Nearby Homes
- 7500 Flag Tail Dr
- 7113 Deer Run Ln
- 14119 Norwood Pond Ln
- 7363 Norwood Pond Place
- 7719 Kentucky Derby Dr
- 7161 Velvet Antler Dr
- 8620 N Spring Run Rd
- 14309 Hancock Towns Dr
- 7506 Winning Colors Ct
- 14501 Hancock Towns Dr
- 7531 Secretariat Dr
- 6555 St Cecelia Dr
- 6806 Full Rack Cir
- 13407 Little Horn Ridge
- 13601 Cannonade Ln
- 6024 Watch Harbour Rd
- 14017 Southshore Rd
- 7417 Hancock Towns Ct
- 14636 Hancock Towns Dr Unit R-4
- 14640 Hancock Towns Dr Unit R-6
- 14107 Key Deer Dr
- 14101 Key Deer Dr
- 7305 Key Deer Ct
- 7302 Key Deer Ct
- 7300 Key Deer Ct
- 14112 Key Deer Dr
- 7307 Key Deer Ct
- 14118 Key Deer Dr
- 14106 Key Deer Dr
- 7304 Key Deer Ct
- 7306 Key Deer Ct
- 7308 Key Deer Ct
- 14124 Key Deer Dr
- 14100 Key Deer Dr
- 7307 Key Deer Cir
- 14130 Key Deer Dr
- 14141 Key Deer Dr
- 14005 Key Deer Dr
- 14113 Branched Antler Dr
- 14119 Branched Antler Dr
Your Personal Tour Guide
Ask me questions while you tour the home.