73167 Emigrant Rd Pendleton, OR 97801
Estimated Value: $600,000 - $1,132,000
5
Beds
3
Baths
3,492
Sq Ft
$227/Sq Ft
Est. Value
About This Home
This home is located at 73167 Emigrant Rd, Pendleton, OR 97801 and is currently estimated at $791,545, approximately $226 per square foot. 73167 Emigrant Rd is a home located in Umatilla County with nearby schools including McKay Creek Elementary School, Sunridge Middle School, and Pendleton High School.
Ownership History
Date
Name
Owned For
Owner Type
Purchase Details
Closed on
May 20, 2015
Sold by
Edwards James R and Edwards Kristina
Bought by
Adams Bradley S and Adams Candelaria D
Current Estimated Value
Home Financials for this Owner
Home Financials are based on the most recent Mortgage that was taken out on this home.
Original Mortgage
$210,000
Interest Rate
3.64%
Mortgage Type
Seller Take Back
Purchase Details
Closed on
May 15, 2015
Sold by
Edwards James R and Edwards Kristina
Bought by
Adams Bradley S and Adams Candelaria D
Home Financials for this Owner
Home Financials are based on the most recent Mortgage that was taken out on this home.
Original Mortgage
$210,000
Interest Rate
3.64%
Mortgage Type
Seller Take Back
Purchase Details
Closed on
Jun 14, 2007
Sold by
Quimby Robert Louis
Bought by
Edwards James R and Edwards Kristina
Create a Home Valuation Report for This Property
The Home Valuation Report is an in-depth analysis detailing your home's value as well as a comparison with similar homes in the area
Purchase History
| Date | Buyer | Sale Price | Title Company |
|---|---|---|---|
| Adams Bradley S | $225,000 | Amerititle | |
| Adams Bradley S | $400,000 | Amerititle | |
| Edwards James R | -- | Amerititle |
Source: Public Records
Mortgage History
| Date | Status | Borrower | Loan Amount |
|---|---|---|---|
| Closed | Adams Bradley S | $210,000 | |
| Open | Adams Bradley S | $353,286 |
Source: Public Records
Tax History
| Year | Tax Paid | Tax Assessment Tax Assessment Total Assessment is a certain percentage of the fair market value that is determined by local assessors to be the total taxable value of land and additions on the property. | Land | Improvement |
|---|---|---|---|---|
| 2025 | $3,973 | $354,244 | $28,764 | $325,480 |
| 2024 | $3,698 | $326,693 | $10,683 | $316,010 |
| 2023 | $3,621 | $317,302 | $10,492 | $306,810 |
| 2022 | $3,416 | $308,182 | $0 | $0 |
| 2021 | $3,413 | $299,322 | $10,122 | $289,200 |
| 2020 | $3,287 | $290,724 | $9,944 | $280,780 |
| 2018 | $3,260 | $274,270 | $9,600 | $264,670 |
| 2017 | $3,182 | $266,404 | $9,434 | $256,970 |
| 2016 | $2,958 | $258,769 | $9,279 | $249,490 |
| 2015 | $3,101 | $205,268 | $23,338 | $181,930 |
| 2014 | -- | $205,268 | $23,338 | $181,930 |
Source: Public Records
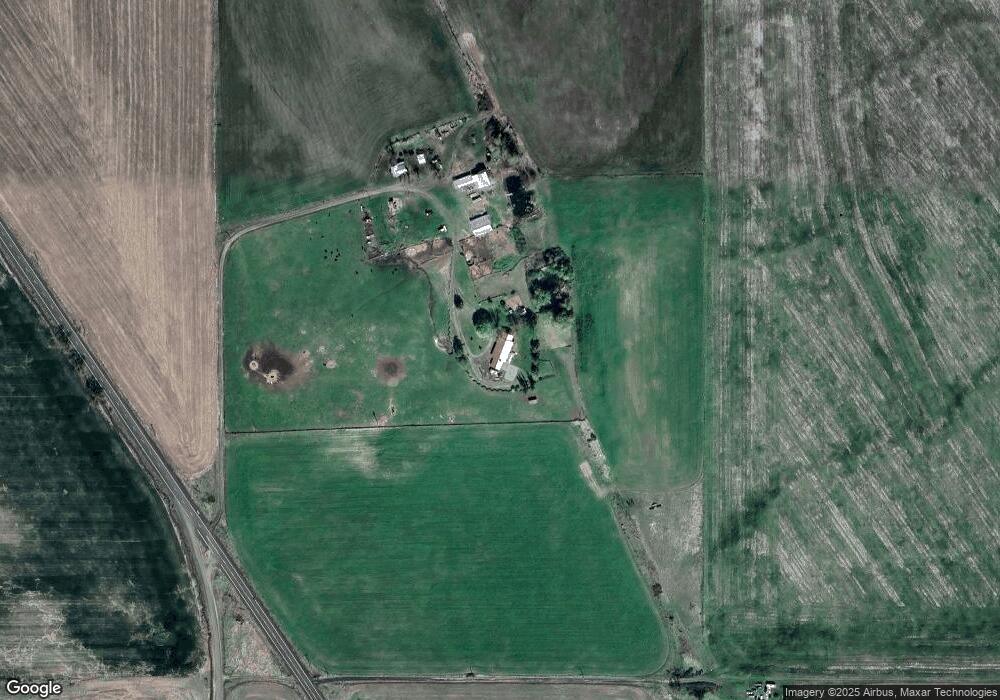
Map
Nearby Homes
- 45315 Trail Dr
- 73426 Memory Ln
- 321 NE 42nd St
- 0 NE School Dr Unit 1-5 23352584
- 3510 NE King Place
- 0000 County 1031 Rd
- 40 NE Mount Hebron Dr
- 11 NE Nelson Dr
- 1914 SE Court Ave
- 1716 SE Court Ave
- 1213 SW 17th Place
- 805 SE 6th St
- 0 Oregon 11
- 0 SW 2nd St Unit 263926795
- 17 SE Kirk Ave
- 1616 SW 2nd St
- 922 S Main St
- 515 SE 4th St
- 612 SE Dorion Ave
- 120 SE 7th St
Your Personal Tour Guide
Ask me questions while you tour the home.