Estimated Value: $240,467 - $253,000
About This Home
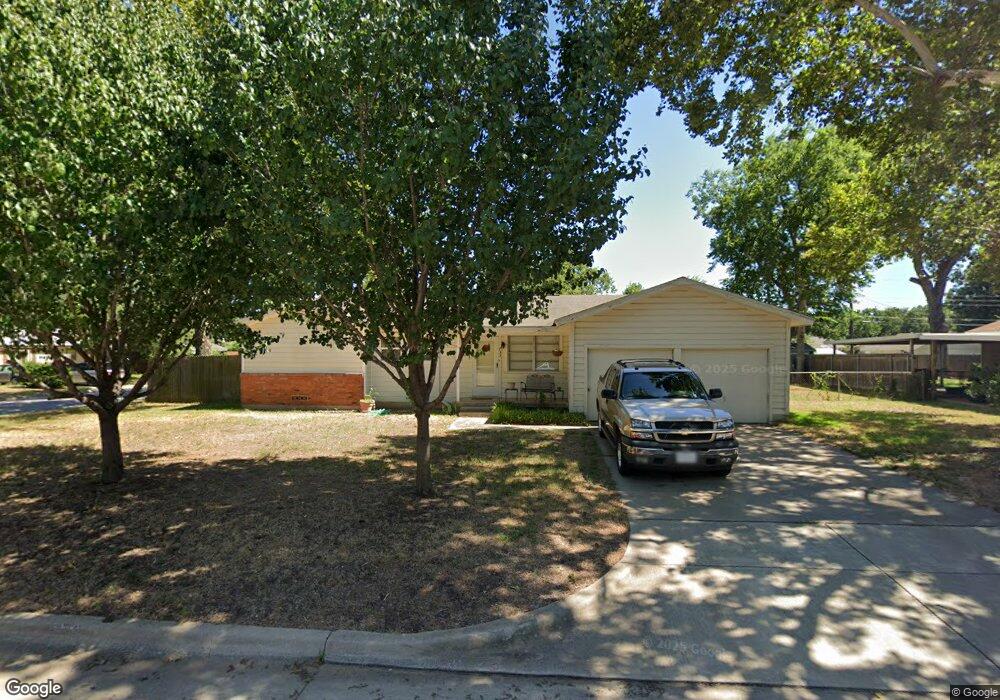
This home is located at 733 Henson Dr, Hurst, TX 76053 and is currently estimated at $245,117, approximately $230 per square foot. 733 Henson Dr is a home located in Tarrant County with nearby schools including West Hurst Elementary School, Hurst J High School, and L.D. Bell High School.
Ownership History
We collect this data history from publicly available records. To have your information removed, we recommend requesting removal directly through your county’s website.
Purchase Details
Home Financials for this Owner
Home Financials are based on the most recent Mortgage that was taken out on this home.Purchase Details
Home Financials for this Owner
Home Financials are based on the most recent Mortgage that was taken out on this home.Purchase Details
Home Values in the Area
Average Home Value in this Area
Purchase History
We collect this data history from publicly available records. To have your information removed, we recommend requesting removal directly through your county’s website.
| Date | Buyer | Sale Price | Title Company |
|---|---|---|---|
| -- | None Available | ||
| -- | First Land Title | ||
| -- | -- |
Mortgage History
We collect this data history from publicly available records. To have your information removed, we recommend requesting removal directly through your county’s website.
| Date | Status | Borrower | Loan Amount |
|---|---|---|---|
| Open | $66,998 | ||
| Closed | $60,800 | ||
| Closed | $0 | ||
| Closed | $15,200 |
Tax History
We collect this data history from publicly available records. To have your information removed, we recommend requesting removal directly through your county’s website.
| Year | Tax Paid | Tax Assessment Tax Assessment Total Assessment is a certain percentage of the fair market value that is determined by local assessors to be the total taxable value of land and additions on the property. | Land | Improvement |
|---|---|---|---|---|
| 2025 | $1,616 | $162,889 | -- | -- |
| 2024 | $1,717 | $225,819 | $60,000 | $165,819 |
| 2023 | $2,697 | $221,907 | $30,000 | $191,907 |
| 2022 | $2,818 | $186,368 | $30,000 | $156,368 |
| 2021 | $2,683 | $168,206 | $30,000 | $138,206 |
| 2020 | $2,433 | $134,447 | $30,000 | $104,447 |
| 2019 | $2,250 | $134,447 | $30,000 | $104,447 |
| 2018 | $1,567 | $83,587 | $18,000 | $65,587 |
| 2017 | $1,923 | $118,170 | $18,000 | $100,170 |
| 2016 | $1,748 | $103,654 | $18,000 | $85,654 |
| 2015 | $1,296 | $62,800 | $12,000 | $50,800 |
| 2014 | $1,296 | $62,800 | $12,000 | $50,800 |
Map
- 741 Cullum Ave
- 616 Post Oak Dr
- 716 Pine St
- 709 Hurstview Dr
- 745 W Cedar St
- 429 Harmon Rd
- 552 Souder Dr
- 444 Billy Creek Cir
- 813 Chase Cir
- 412 Twin Creek Dr
- 309 Elm St
- 1445 Hurstview Dr
- 636 Timberline Dr
- 619 Timberline Dr
- 108 Reaves Ln
- 612 Ridgeline Dr
- 307 Norwood Dr
- 237 Bradford Dr
- 649 Timberline Dr
- 623 Ridgeline Dr
- 321 Anderson Dr
- 737 Henson Dr
- 401 Anderson Dr
- 317 Anderson Dr
- 324 Anderson Dr
- 741 Henson Dr
- 736 Henson Dr
- 328 Anderson Dr
- 320 Anderson Dr
- 736 Thomas Ave
- 400 Anderson Dr
- 316 Anderson Dr
- 405 Anderson Dr
- 740 Henson Dr
- 740 Thomas Ave
- 745 Henson Dr
- 404 Anderson Dr
- 312 Anderson Dr
- 744 Henson Dr
- 744 Thomas Ave
Ask me questions while you tour the home.