
Seller's Agent in 2021
Susan Michaels
Coldwell Banker Realty
(207) 205-3060
33 in this area
67 Total Sales

Estimated Value: $86,000 - $108,000
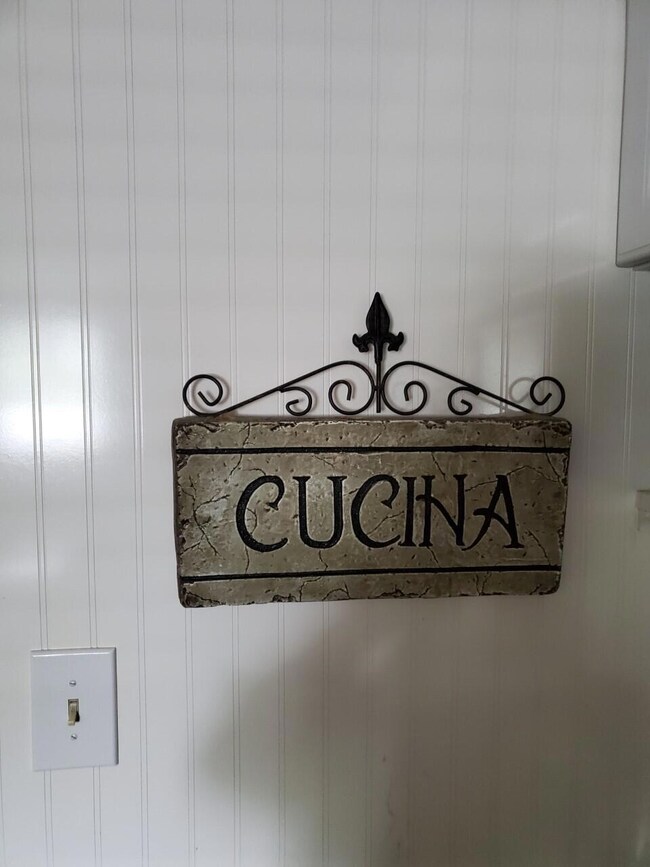
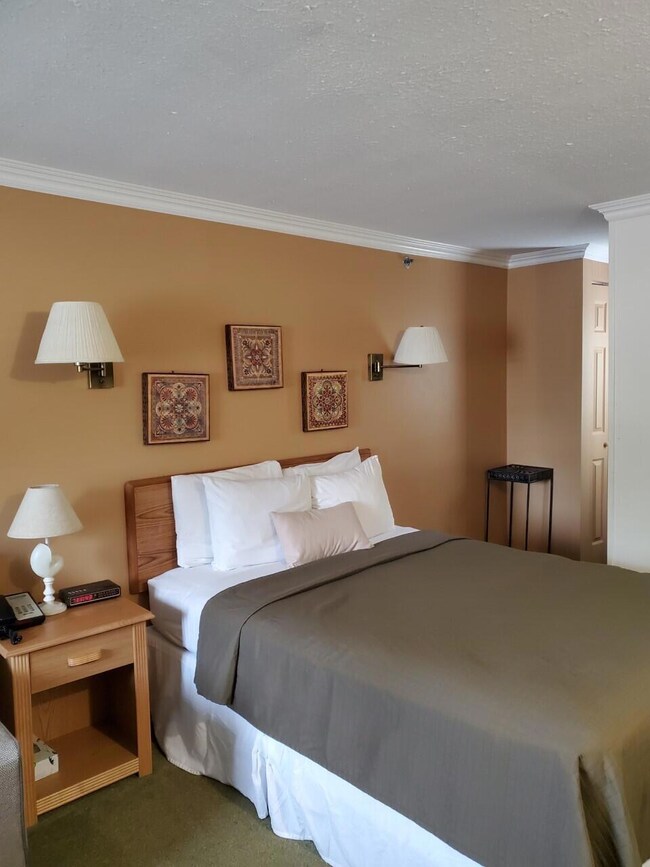
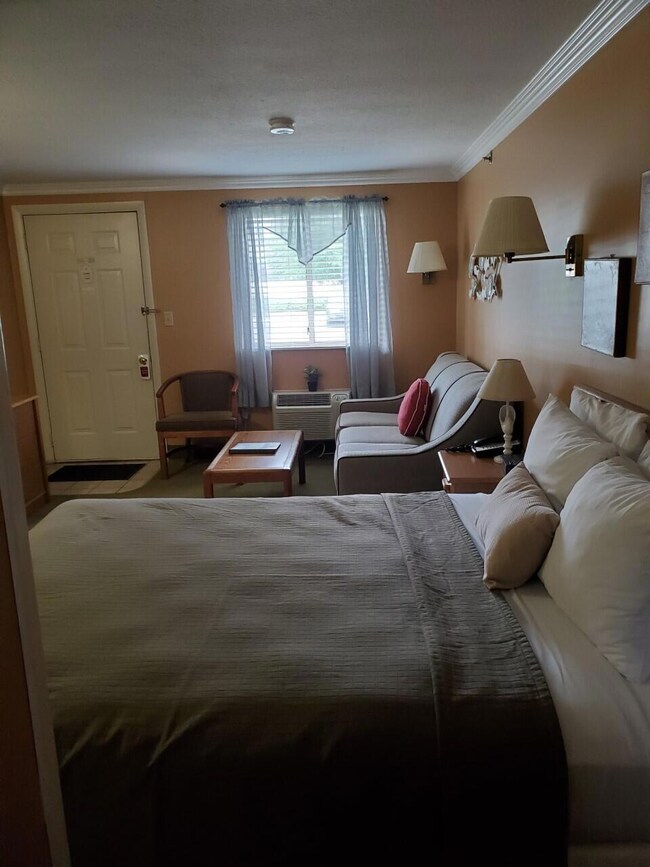
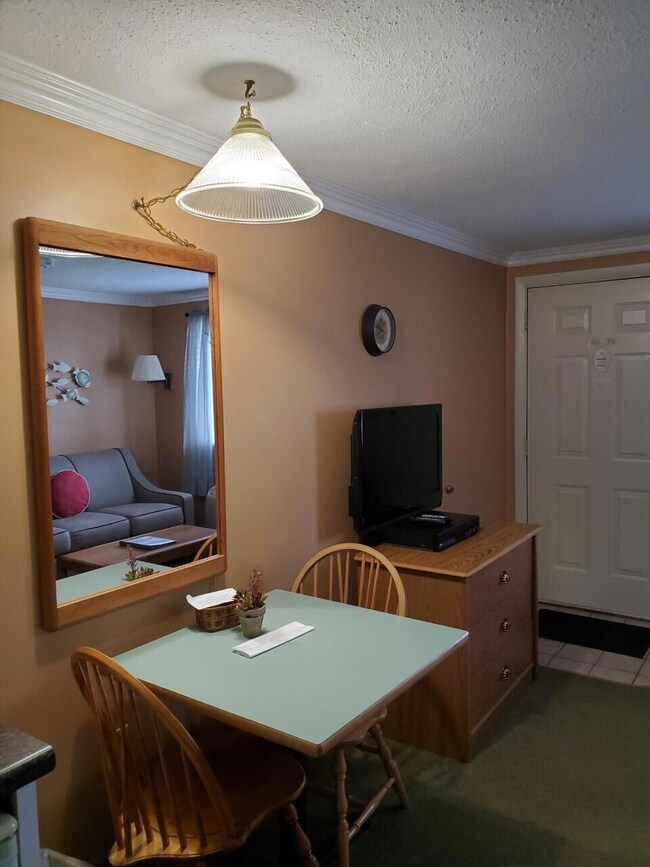
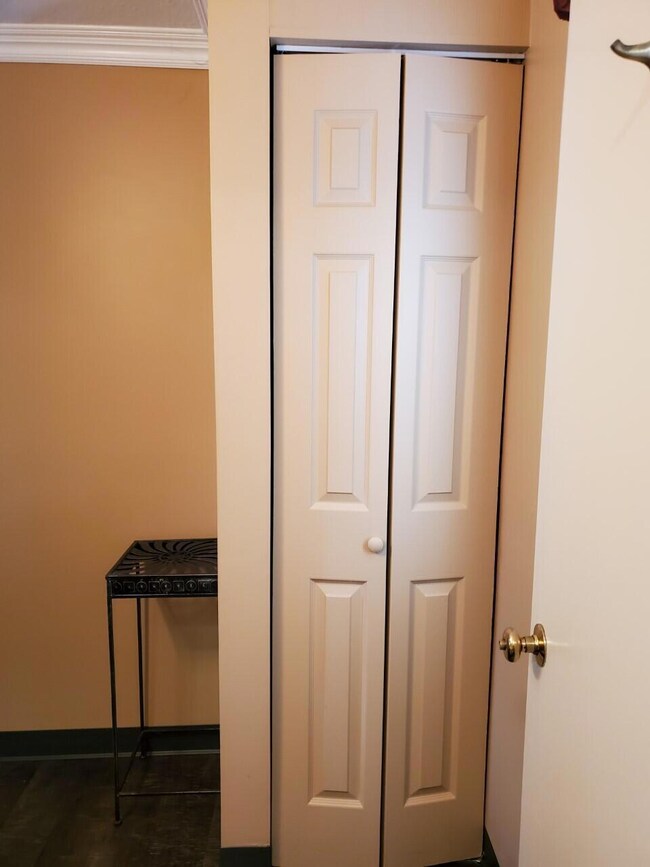
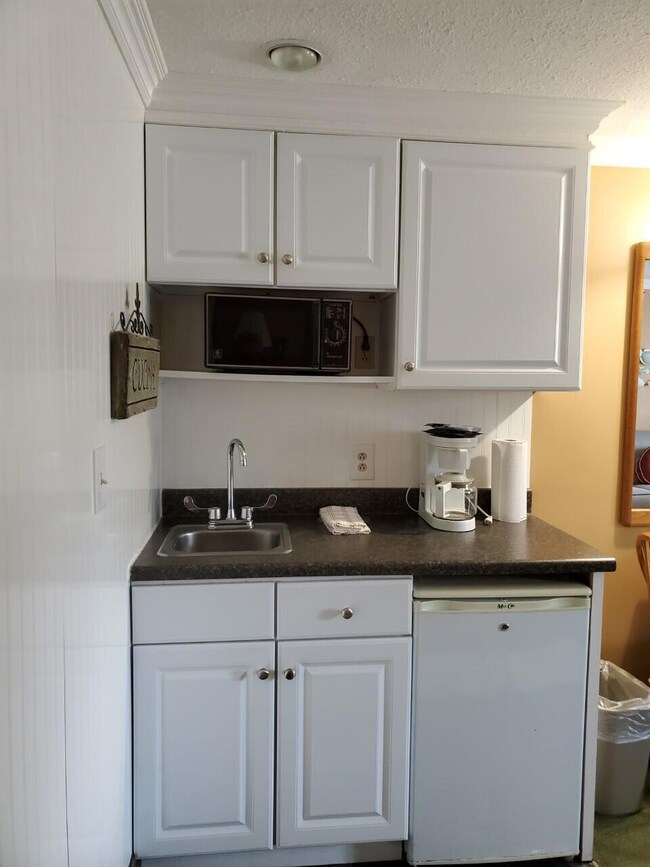
Have you been looking for an affordable condo in Wells to enjoy or as an investment? THIS IS IT! First Lovel easy access, Fully furnished, sitting area pull out sleep sofa handy kitchenette with micro fridge and table and chairs all ready for you. Conveniently located on the trolley line so you can zip into Ogunquit to check out the wonderful restaurants . quaint little shops and beautiful beach or hit the restaurants shopping and beach in Wells and not have to worry about traffic or parking. NICE! Reasonable condo fees $700 quarterly which includes everything except property taxes annually $325 and a capital improvement contribution which varies from year to year, Great rental income property. There is a exercise room, coin operated laundry, indoor pool and hot tub, sundeck playground and grilling area. On site rental management if you prefer to rent your condo Conveniently located to enjoy all restaurants, beaches and shopping . Pets ae welcome for Owners. 2021 Rentals in place will need to be honored. Showings will depend upon availability. Open mid April to mid December
Last Agent to Sell the Property
Coldwell Banker Realty Brokerage Phone: 207-967-9900 Listed on: 07/18/2021
Last Buyer's Agent
Susan Michaels
Better Homes & Gardens Real Estate/The Masiello Group
| Date | Event | Price | List to Sale | Price per Sq Ft |
|---|---|---|---|---|
| 08/13/2021 08/13/21 | Sold | $42,500 | +1.2% | $161 / Sq Ft |
| 07/20/2021 07/20/21 | Pending | -- | -- | -- |
| 07/18/2021 07/18/21 | For Sale | $42,000 | -- | $159 / Sq Ft |
| Year | Tax Paid | Tax Assessment Tax Assessment Total Assessment is a certain percentage of the fair market value that is determined by local assessors to be the total taxable value of land and additions on the property. | Land | Improvement |
|---|---|---|---|---|
| 2025 | $552 | $85,380 | $34,670 | $50,710 |
| 2024 | $519 | $85,380 | $34,670 | $50,710 |
| 2023 | $398 | $66,820 | $34,670 | $32,150 |
| 2022 | $324 | $31,010 | $15,740 | $15,270 |
| 2021 | $326 | $31,010 | $15,740 | $15,270 |
| 2020 | $325 | $31,010 | $15,740 | $15,270 |
| 2019 | $323 | $31,010 | $15,740 | $15,270 |
| 2018 | $314 | $31,010 | $15,740 | $15,270 |
| 2017 | $315 | $31,010 | $15,740 | $15,270 |
| 2016 | $312 | $31,010 | $15,740 | $15,270 |
| 2015 | $309 | $31,010 | $15,740 | $15,270 |
| 2013 | $283 | $31,010 | $15,740 | $15,270 |
Seller's Agent in 2021
Susan Michaels
Coldwell Banker Realty
(207) 205-3060
33 in this area
67 Total Sales
Source: Maine Listings
MLS Number: 1501129
APN: WLLS-000117-000058-000000-000132
Disclaimer: Certain information contained herein is derived from information provided by parties other than Homes.com. All information provided is deemed reliable, but is not guaranteed to be accurate and should be independently verified.
![]() Listing data is derived in whole or in part from Maine Real Estate Information System, Inc. (d/b/a Maine Listings) and is for consumers' personal, noncommercial use only. Dimensions are approximate and not guaranteed. All data should be independently verified.
Listing data is derived in whole or in part from Maine Real Estate Information System, Inc. (d/b/a Maine Listings) and is for consumers' personal, noncommercial use only. Dimensions are approximate and not guaranteed. All data should be independently verified.
© 2026 Maine Real Estate Information System, Inc. All Rights Reserved. Equal Housing Opportunity.
Homes.com, LLC, 17600 Laguna Canyon Rd Irvine, CA 92618 (888)-952-6393
![]()
Ask me questions while you tour the home.