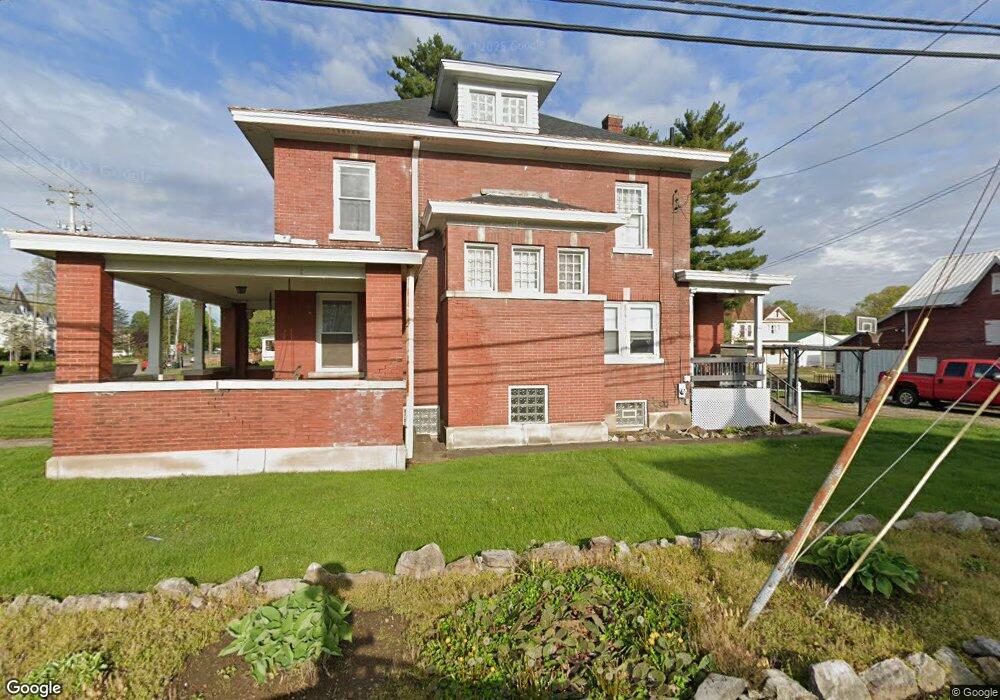
734 E Main St Newark, OH 43055
Estimated Value: $212,000 - $276,000
4
Beds
2
Baths
2,190
Sq Ft
$116/Sq Ft
Est. Value
About This Home
This home is located at 734 E Main St, Newark, OH 43055 and is currently estimated at $253,428, approximately $115 per square foot. 734 E Main St is a home located in Licking County with nearby schools including Carson Elementary School, Heritage Middle School, and Newark High School.
Ownership History
Date
Name
Owned For
Owner Type
Purchase Details
Closed on
Oct 28, 2008
Sold by
Gartner Marla Kaye
Bought by
Leos Ace In The Hole Llc
Current Estimated Value
Purchase Details
Closed on
Dec 31, 2004
Sold by
Krempel Ganelle A and Baker Ganelle
Bought by
Baker Mark R and Baker Ganelle
Home Financials for this Owner
Home Financials are based on the most recent Mortgage that was taken out on this home.
Original Mortgage
$78,800
Interest Rate
5.83%
Mortgage Type
New Conventional
Create a Home Valuation Report for This Property
The Home Valuation Report is an in-depth analysis detailing your home's value as well as a comparison with similar homes in the area
Home Values in the Area
Average Home Value in this Area
Purchase History
| Date | Buyer | Sale Price | Title Company |
|---|---|---|---|
| Leos Ace In The Hole Llc | -- | Attorney | |
| Baker Mark R | -- | Nations Title Of Louisiana |
Source: Public Records
Mortgage History
| Date | Status | Borrower | Loan Amount |
|---|---|---|---|
| Previous Owner | Baker Mark R | $78,800 |
Source: Public Records
Tax History
| Year | Tax Paid | Tax Assessment Tax Assessment Total Assessment is a certain percentage of the fair market value that is determined by local assessors to be the total taxable value of land and additions on the property. | Land | Improvement |
|---|---|---|---|---|
| 2024 | $3,054 | $85,230 | $16,310 | $68,920 |
| 2023 | $3,048 | $85,230 | $16,310 | $68,920 |
| 2022 | $2,784 | $69,300 | $9,800 | $59,500 |
| 2021 | $2,920 | $69,300 | $9,800 | $59,500 |
| 2020 | $2,986 | $69,300 | $9,800 | $59,500 |
| 2019 | $2,496 | $55,760 | $8,160 | $47,600 |
| 2018 | $2,497 | $0 | $0 | $0 |
| 2017 | $2,088 | $0 | $0 | $0 |
| 2016 | $1,915 | $0 | $0 | $0 |
| 2015 | $1,957 | $0 | $0 | $0 |
| 2014 | $2,507 | $0 | $0 | $0 |
| 2013 | $1,852 | $0 | $0 | $0 |
Source: Public Records
Map
Nearby Homes
- 20 Bolen Ave
- 0 Monroe Ave Unit Lot 1612
- 0 Monroe Ave
- 49 Monroe Ave
- 106 Monroe Ave
- 874 Brice St
- 112 Oakwood Ave
- 417 Tuscarawas St
- 167 Essex St
- 331 Eastern Ave
- 468 Garfield Ave
- 934 Garfield Ave
- 870 Jones St
- 978 Blueberry Ct
- 239 N Cedar St
- 31 S Webb St
- 351 Barclay St
- 397 Arlington Ave
- 337 Schuler St
- 205 Hunter St
Your Personal Tour Guide
Ask me questions while you tour the home.