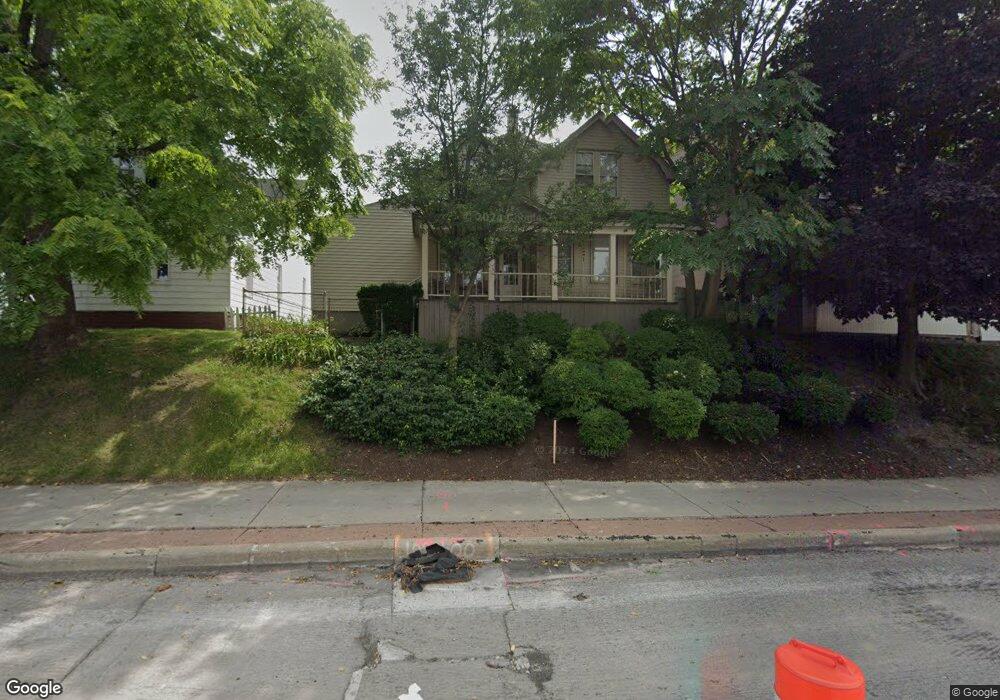
735 Eureka Rd Wyandotte, MI 48192
Estimated Value: $201,000 - $225,000
Studio
--
Bath
1,905
Sq Ft
$109/Sq Ft
Est. Value
About This Home
This home is located at 735 Eureka Rd, Wyandotte, MI 48192 and is currently estimated at $208,373, approximately $109 per square foot. 735 Eureka Rd is a home located in Wayne County with nearby schools including Monroe Elementary School, Woodrow Wilson School, and Roosevelt High School.
Ownership History
Date
Name
Owned For
Owner Type
Purchase Details
Closed on
May 13, 2019
Sold by
Sutphin Dorothy L
Bought by
Sutphin Thomas F and Sutphin Kim M
Current Estimated Value
Home Financials for this Owner
Home Financials are based on the most recent Mortgage that was taken out on this home.
Original Mortgage
$128,205
Interest Rate
4.62%
Mortgage Type
FHA
Purchase Details
Closed on
Jan 3, 2008
Sold by
Sutphin Dorothy L
Bought by
Sutphin Dorothy L
Create a Home Valuation Report for This Property
The Home Valuation Report is an in-depth analysis detailing your home's value as well as a comparison with similar homes in the area
Home Values in the Area
Average Home Value in this Area
Purchase History
| Date | Buyer | Sale Price | Title Company |
|---|---|---|---|
| Sutphin Thomas F | -- | Mortgage Center Title Llc | |
| Sutphin Dorothy L | -- | None Available |
Source: Public Records
Mortgage History
| Date | Status | Borrower | Loan Amount |
|---|---|---|---|
| Closed | Sutphin Thomas F | $128,205 |
Source: Public Records
Tax History
| Year | Tax Paid | Tax Assessment Tax Assessment Total Assessment is a certain percentage of the fair market value that is determined by local assessors to be the total taxable value of land and additions on the property. | Land | Improvement |
|---|---|---|---|---|
| 2025 | $3,261 | $99,500 | $0 | $0 |
| 2024 | $3,169 | $97,900 | $0 | $0 |
| 2023 | $3,022 | $94,500 | $0 | $0 |
| 2022 | $3,710 | $92,300 | $0 | $0 |
| 2021 | $3,629 | $85,700 | $0 | $0 |
| 2020 | $5,022 | $69,000 | $0 | $0 |
| 2019 | $3,527 | $66,500 | $0 | $0 |
| 2018 | $2,660 | $66,600 | $0 | $0 |
| 2017 | $1,537 | $66,600 | $0 | $0 |
| 2016 | $3,397 | $59,500 | $0 | $0 |
| 2015 | $5,213 | $55,200 | $0 | $0 |
| 2013 | $5,050 | $50,500 | $0 | $0 |
| 2012 | $2,272 | $52,900 | $8,000 | $44,900 |
Source: Public Records
Map
Nearby Homes
Your Personal Tour Guide
Ask me questions while you tour the home.