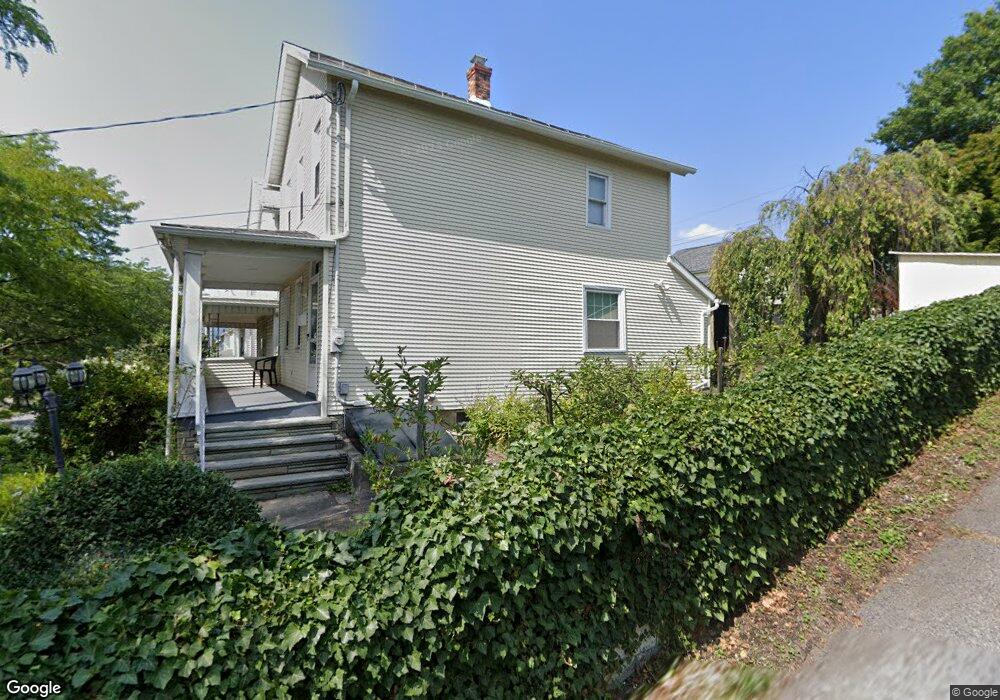
735 Maple St Scranton, PA 18505
South Side NeighborhoodEstimated Value: $131,000 - $196,000
2
Beds
1
Bath
1,700
Sq Ft
$92/Sq Ft
Est. Value
About This Home
This home is located at 735 Maple St, Scranton, PA 18505 and is currently estimated at $156,595, approximately $92 per square foot. 735 Maple St is a home located in Lackawanna County with nearby schools including McNichols Plaza Elementary School, South Scranton Intermediate, and West Scranton High School.
Ownership History
Date
Name
Owned For
Owner Type
Purchase Details
Closed on
Feb 24, 2011
Sold by
Deutsche Bank National Trust Company
Bought by
Edwards Maryellen
Current Estimated Value
Purchase Details
Closed on
Feb 9, 2011
Sold by
Kane Robert
Bought by
Deutsche Bank National Trust Company
Purchase Details
Closed on
Dec 21, 2005
Sold by
Home Improvers Llc
Bought by
Kane Robert
Home Financials for this Owner
Home Financials are based on the most recent Mortgage that was taken out on this home.
Original Mortgage
$82,555
Interest Rate
9.5%
Mortgage Type
Adjustable Rate Mortgage/ARM
Purchase Details
Closed on
Aug 12, 2005
Sold by
Geary Joseph J
Bought by
Wells Fargo Na
Purchase Details
Closed on
Aug 11, 2005
Sold by
Wells Fargo Bank Na
Bought by
Home Improvers Llc
Create a Home Valuation Report for This Property
The Home Valuation Report is an in-depth analysis detailing your home's value as well as a comparison with similar homes in the area
Home Values in the Area
Average Home Value in this Area
Purchase History
| Date | Buyer | Sale Price | Title Company |
|---|---|---|---|
| Edwards Maryellen | $31,000 | None Available | |
| Deutsche Bank National Trust Company | $2,690 | None Available | |
| Kane Robert | $86,900 | None Available | |
| Wells Fargo Na | $2,884 | None Available | |
| Home Improvers Llc | $40,000 | Independence Abstract & Titl |
Source: Public Records
Mortgage History
| Date | Status | Borrower | Loan Amount |
|---|---|---|---|
| Previous Owner | Kane Robert | $82,555 |
Source: Public Records
Tax History
| Year | Tax Paid | Tax Assessment Tax Assessment Total Assessment is a certain percentage of the fair market value that is determined by local assessors to be the total taxable value of land and additions on the property. | Land | Improvement |
|---|---|---|---|---|
| 2025 | $2,348 | $7,000 | $1,600 | $5,400 |
| 2024 | $2,152 | $7,000 | $1,600 | $5,400 |
| 2023 | $2,152 | $7,000 | $1,600 | $5,400 |
| 2022 | $2,105 | $7,000 | $1,600 | $5,400 |
| 2021 | $2,105 | $7,000 | $1,600 | $5,400 |
| 2020 | $2,067 | $7,000 | $1,600 | $5,400 |
| 2019 | $1,946 | $7,000 | $1,600 | $5,400 |
| 2018 | $1,946 | $7,000 | $1,600 | $5,400 |
| 2017 | $1,913 | $7,000 | $1,600 | $5,400 |
| 2016 | $645 | $7,000 | $1,600 | $5,400 |
| 2015 | $1,125 | $7,000 | $1,600 | $5,400 |
| 2014 | -- | $7,000 | $1,600 | $5,400 |
Source: Public Records
Map
Nearby Homes
- 1024 S Webster Ave
- 641 E Elm St
- 635 E Elm St Unit Rear
- 616 Birch St
- 718 Willow St
- 932 Prospect Ave
- 812 Willow St
- 613 E Locust St
- 1017 Hamm Ct
- 955 E Elm St
- 715 Alder St
- 954 E Elm St
- 623 Crown Ave
- 840 Alder St
- 828 Pittston Ave
- 1131 Pittston Ave
- 710 Pittston Ave
- 1401 Prospect Ave
- 437 Birch St Unit REAR
- 514 Brook St
Your Personal Tour Guide
Ask me questions while you tour the home.