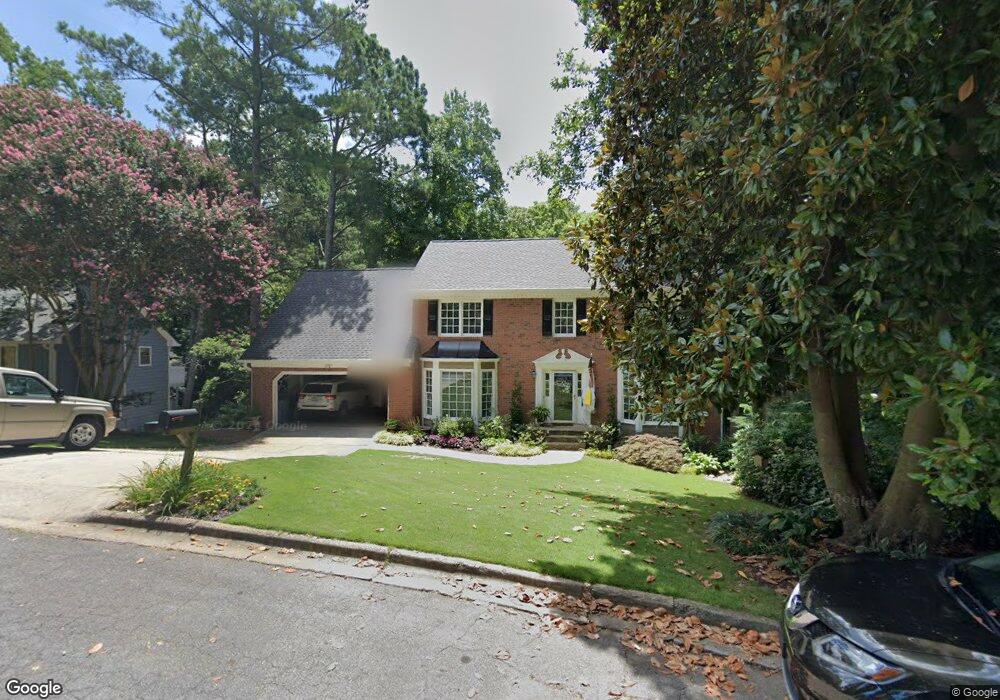
735 Springview Ct Unit 3A Roswell, GA 30076
Estimated Value: $529,000 - $653,000
4
Beds
4
Baths
2,630
Sq Ft
$227/Sq Ft
Est. Value
About This Home
This home is located at 735 Springview Ct Unit 3A, Roswell, GA 30076 and is currently estimated at $598,150, approximately $227 per square foot. 735 Springview Ct Unit 3A is a home located in Fulton County with nearby schools including Northwood Elementary School, Haynes Bridge Middle School, and Centennial High School.
Ownership History
Date
Name
Owned For
Owner Type
Purchase Details
Closed on
Dec 12, 2025
Sold by
Mayville Laura M
Bought by
Mayville Family Trust and Mayville Laura M
Current Estimated Value
Purchase Details
Closed on
Apr 18, 2008
Sold by
Mayville Patrick J and Mayville Laura M
Bought by
Mayville Patrick J and Mayville Laura M
Purchase Details
Closed on
Jun 30, 1999
Sold by
Schaffers Wilhelmus J and Schaffers Karen
Bought by
Mayville Patrick J and Mayville Laura M
Home Financials for this Owner
Home Financials are based on the most recent Mortgage that was taken out on this home.
Original Mortgage
$196,400
Interest Rate
7.65%
Mortgage Type
New Conventional
Purchase Details
Closed on
Jun 18, 1993
Sold by
Shea James T Adele M
Bought by
Schaffers Wilhelmus J
Home Financials for this Owner
Home Financials are based on the most recent Mortgage that was taken out on this home.
Original Mortgage
$143,100
Interest Rate
7.52%
Create a Home Valuation Report for This Property
The Home Valuation Report is an in-depth analysis detailing your home's value as well as a comparison with similar homes in the area
Home Values in the Area
Average Home Value in this Area
Purchase History
| Date | Buyer | Sale Price | Title Company |
|---|---|---|---|
| Mayville Family Trust | -- | -- | |
| Mayville Patrick J | -- | -- | |
| Mayville Patrick J | $245,500 | -- | |
| Schaffers Wilhelmus J | $159,000 | -- |
Source: Public Records
Mortgage History
| Date | Status | Borrower | Loan Amount |
|---|---|---|---|
| Previous Owner | Mayville Patrick J | $196,400 | |
| Previous Owner | Schaffers Wilhelmus J | $143,100 |
Source: Public Records
Tax History
| Year | Tax Paid | Tax Assessment Tax Assessment Total Assessment is a certain percentage of the fair market value that is determined by local assessors to be the total taxable value of land and additions on the property. | Land | Improvement |
|---|---|---|---|---|
| 2025 | $729 | $200,120 | $57,560 | $142,560 |
| 2023 | $5,904 | $209,160 | $58,480 | $150,680 |
| 2022 | $2,997 | $176,920 | $39,680 | $137,240 |
| 2021 | $3,552 | $152,240 | $35,200 | $117,040 |
| 2020 | $3,607 | $152,040 | $31,080 | $120,960 |
| 2019 | $587 | $155,720 | $42,600 | $113,120 |
| 2018 | $3,374 | $139,640 | $29,200 | $110,440 |
| 2017 | $2,910 | $111,680 | $22,320 | $89,360 |
| 2016 | $2,909 | $111,680 | $22,320 | $89,360 |
| 2015 | $3,530 | $111,680 | $22,320 | $89,360 |
| 2014 | $3,033 | $111,680 | $22,320 | $89,360 |
Source: Public Records
Map
Nearby Homes
- 590 Ridgemont Dr
- 455 High Pointe Trail
- 515 Willow Oak Way
- 535 Water Shadow Ln
- 151 W Ridge Way
- 260 Spring Ridge Dr
- 145 W Ridge Way
- 125 Brier Ct
- 115 Centennial Trace
- 825 Lake Forest Cir
- 115 Forest Breeze Cove
- 1245 Terramont Dr
- 330 Mistwater Trace Unit 3
- 1050 Terramont Dr
- 9950 Lake Forest Way
- 615 Lake Forest Ct
- 1370 Terramont Dr
- 350 S Satinwood Place
- 650 Wood Work Way
- 6015 Richwood Cir
- 725 Springview Ct Unit 3A
- 745 Springview Ct
- 720 Springview Ct
- 715 Springview Ct
- 755 Springview Ct
- 750 Springview Ct
- 515 Ridgemont Dr
- 500 Ridgemont Dr
- 765 Springview Ct Unit 3A
- 525 Ridgemont Dr
- 695 Springview Ct
- 680 Springview Ct
- 510 Ridgemont Dr
- 760 Springview Ct
- 760 Springview Ct Unit 3A
- 775 Springview Ct
- 535 Ridgemont Dr Unit 3B
- 770 Springview Ct Unit 3A
- 520 Ridgemont Dr Unit 3B
- 670 Springview Ct
Your Personal Tour Guide
Ask me questions while you tour the home.