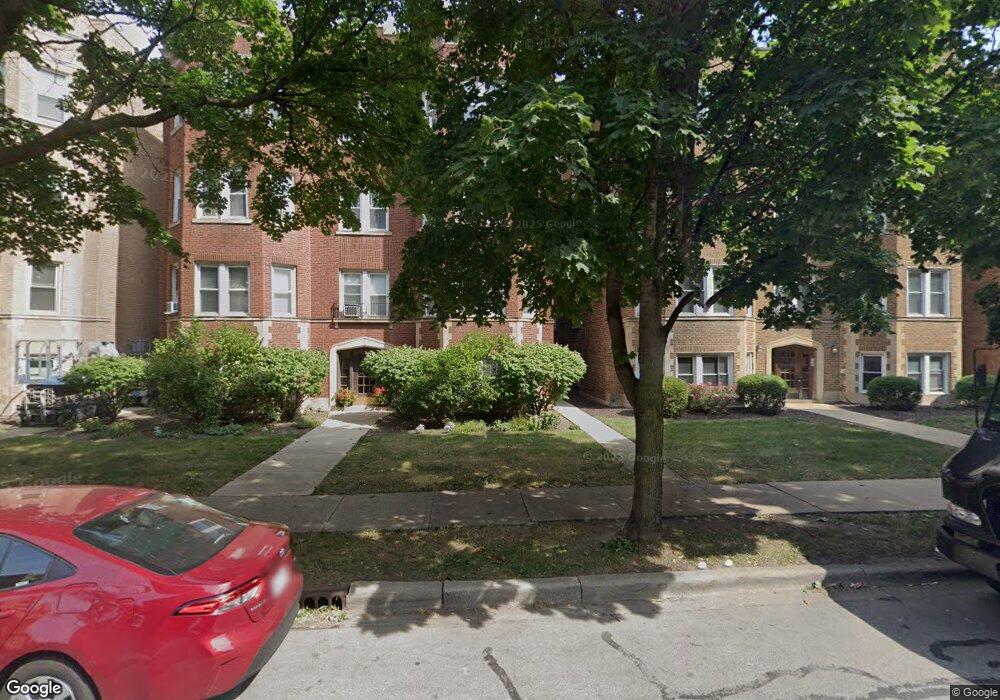
7352 Lake St Unit 2W River Forest, IL 60305
Estimated Value: $274,280 - $346,000
3
Beds
1
Bath
1,336
Sq Ft
$225/Sq Ft
Est. Value
About This Home
This home is located at 7352 Lake St Unit 2W, River Forest, IL 60305 and is currently estimated at $300,820, approximately $225 per square foot. 7352 Lake St Unit 2W is a home located in Cook County with nearby schools including Lincoln Elementary School, Roosevelt Middle School, and Oak Park and River Forest High School.
Ownership History
Date
Name
Owned For
Owner Type
Purchase Details
Closed on
Dec 14, 2015
Sold by
Zhang Beihong and Mei Songlin
Bought by
Boneau Denise
Current Estimated Value
Home Financials for this Owner
Home Financials are based on the most recent Mortgage that was taken out on this home.
Original Mortgage
$115,000
Outstanding Balance
$90,387
Interest Rate
3.93%
Mortgage Type
New Conventional
Estimated Equity
$210,433
Purchase Details
Closed on
Oct 29, 2004
Sold by
Hanrahan Mary Ellen
Bought by
Zhang Beihong
Home Financials for this Owner
Home Financials are based on the most recent Mortgage that was taken out on this home.
Original Mortgage
$223,850
Interest Rate
4.37%
Mortgage Type
Unknown
Create a Home Valuation Report for This Property
The Home Valuation Report is an in-depth analysis detailing your home's value as well as a comparison with similar homes in the area
Home Values in the Area
Average Home Value in this Area
Purchase History
| Date | Buyer | Sale Price | Title Company |
|---|---|---|---|
| Boneau Denise | $220,000 | Baird & Warner Title Svcs In | |
| Boneau Denise | $220,000 | Baird & Warner Title Svcs In | |
| Zhang Beihong | $249,000 | Chicago Title Insurance Comp | |
| Zhang Beihong | $249,000 | Chicago Title Insurance Comp |
Source: Public Records
Mortgage History
| Date | Status | Borrower | Loan Amount |
|---|---|---|---|
| Open | Boneau Denise | $115,000 | |
| Previous Owner | Zhang Beihong | $223,850 |
Source: Public Records
Tax History
| Year | Tax Paid | Tax Assessment Tax Assessment Total Assessment is a certain percentage of the fair market value that is determined by local assessors to be the total taxable value of land and additions on the property. | Land | Improvement |
|---|---|---|---|---|
| 2025 | $4,487 | $19,706 | $1,504 | $18,202 |
| 2024 | $4,487 | $19,706 | $1,504 | $18,202 |
| 2023 | $4,821 | $19,706 | $1,504 | $18,202 |
| 2022 | $4,821 | $18,352 | $1,707 | $16,645 |
| 2021 | $4,671 | $18,351 | $1,706 | $16,645 |
| 2020 | $4,634 | $18,351 | $1,706 | $16,645 |
| 2019 | $5,765 | $22,000 | $1,562 | $20,438 |
| 2018 | $5,456 | $22,000 | $1,562 | $20,438 |
| 2017 | $5,454 | $22,000 | $1,562 | $20,438 |
| 2016 | $6,367 | $22,289 | $1,301 | $20,988 |
| 2015 | $6,215 | $22,289 | $1,301 | $20,988 |
| 2014 | $5,709 | $22,289 | $1,301 | $20,988 |
| 2013 | $5,422 | $21,845 | $1,301 | $20,544 |
Source: Public Records
Map
Nearby Homes
- 7348 Lake St Unit 2E
- 7346 Lake St Unit GW
- 510 Bonnie Brae Place Unit K3
- 1146 Ontario St Unit 1E
- 618 Monroe Ave
- 710 William St
- 1103 Holly Ct Unit 207
- 1103 Holly Ct Unit 306
- 7204 Oak Ave Unit 1NW
- 1125 Erie St
- 7415 Dixon St
- 7200 Oak Ave Unit 3NW
- 711 Jackson Ave
- 7210 Oak Ave Unit 4SW
- 200 S Maple Ave Unit 12
- 140 Marengo Ave Unit 105
- 300 N Maple Ave
- 227 N Marion St
- 222 N Marion St Unit 2J
- 411 Ashland Ave Unit 1A
- 7354 Lake St Unit 3W
- 7352 Lake St Unit 1E
- 7352 Lake St Unit P5
- 7352 Lake St Unit P3
- 7352 Lake St Unit P2
- 7352 Lake St Unit 3W
- 7354 Lake St Unit GW
- 7352 Lake St Unit P1
- 7352 Lake St Unit 2E
- 7352 Lake St Unit P4
- 7352 Lake St Unit 1W
- 7352 Lake St Unit 3E
- 7354 Lake St Unit 2W
- 7354 Lake St Unit 1W
- 7354 Lake St Unit G
- 7350 Lake St Unit G
- 7350 Lake St Unit 2W
- 7356 Lake St
- 7348 Lake St Unit 2W
- 7348 Lake St Unit 1W
Your Personal Tour Guide
Ask me questions while you tour the home.