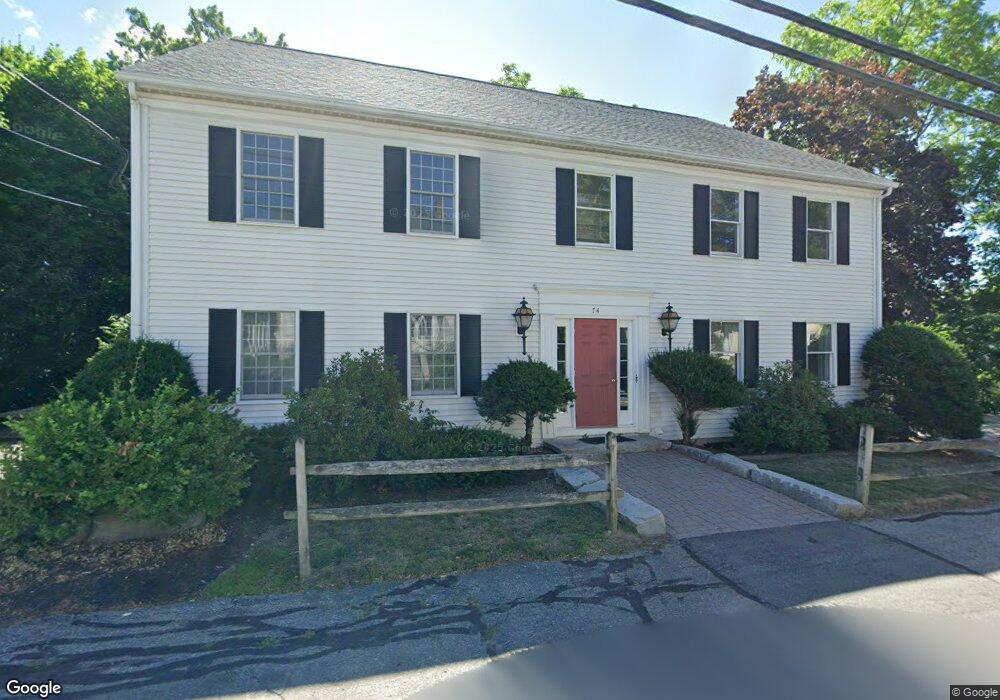
74 Second St Hallowell, ME 04347
Estimated Value: $446,000 - $526,068
2
Beds
3
Baths
3,264
Sq Ft
$148/Sq Ft
Est. Value
About This Home
This home is located at 74 Second St, Hallowell, ME 04347 and is currently estimated at $484,267, approximately $148 per square foot. 74 Second St is a home with nearby schools including Dresden Elementary School, Marcia Buker School, and Monmouth Memorial School.
Ownership History
Date
Name
Owned For
Owner Type
Purchase Details
Closed on
Oct 6, 2025
Sold by
Capital City Prop Llc
Bought by
Mahoney David
Current Estimated Value
Home Financials for this Owner
Home Financials are based on the most recent Mortgage that was taken out on this home.
Original Mortgage
$365,500
Outstanding Balance
$362,873
Interest Rate
6.58%
Mortgage Type
New Conventional
Estimated Equity
$121,394
Purchase Details
Closed on
Dec 18, 2013
Sold by
Wartman Brynn and Wartman Jed W
Bought by
Dufour Kate
Purchase Details
Closed on
Oct 3, 2013
Sold by
Historic Hallowell Props
Bought by
Capital City Props Llc
Purchase Details
Closed on
Sep 1, 2011
Sold by
M Blais Props Llc
Bought by
Historic Hallowell Props
Purchase Details
Closed on
Jul 29, 2011
Sold by
Blais Maurice
Bought by
M Blais Props Llc
Create a Home Valuation Report for This Property
The Home Valuation Report is an in-depth analysis detailing your home's value as well as a comparison with similar homes in the area
Home Values in the Area
Average Home Value in this Area
Purchase History
We collect this data history from publicly available records. To have your information removed, we recommend requesting removal directly through your county’s website.
| Date | Buyer | Sale Price | Title Company |
|---|---|---|---|
| Mahoney David | $430,000 | -- | |
| Dufour Kate | -- | -- | |
| Dufour Kate F | -- | -- | |
| Capital City Props Llc | -- | -- | |
| Capital City Props Llc | -- | -- | |
| Historic Hallowell Props | -- | -- | |
| Historic Hallowell Props | -- | -- | |
| Historic Hallowell Props | -- | -- | |
| Historic Hallowell Props | -- | -- | |
| M Blais Props Llc | -- | -- | |
| M Blais Props Llc | -- | -- | |
| M Blais Props Llc | -- | -- | |
| M Blais Props Llc | -- | -- | |
| M Blais Props Llc | -- | -- | |
| M Blais Props Llc | -- | -- |
Source: Public Records
Mortgage History
We collect this data history from publicly available records. To have your information removed, we recommend requesting removal directly through your county’s website.
| Date | Status | Borrower | Loan Amount |
|---|---|---|---|
| Open | Mahoney David | $365,500 |
Source: Public Records
Tax History
| Year | Tax Paid | Tax Assessment Tax Assessment Total Assessment is a certain percentage of the fair market value that is determined by local assessors to be the total taxable value of land and additions on the property. | Land | Improvement |
|---|---|---|---|---|
| 2025 | $5,199 | $272,200 | $23,400 | $248,800 |
| 2024 | $8,296 | $416,900 | $71,200 | $345,700 |
| 2023 | $6,989 | $303,200 | $51,800 | $251,400 |
| 2022 | $6,731 | $303,200 | $51,800 | $251,400 |
| 2021 | $6,458 | $303,200 | $51,800 | $251,400 |
| 2020 | $6,519 | $303,200 | $51,800 | $251,400 |
| 2019 | $6,458 | $303,200 | $51,800 | $251,400 |
| 2018 | $5,973 | $303,200 | $51,800 | $251,400 |
| 2017 | $5,973 | $303,200 | $51,800 | $251,400 |
| 2016 | $5,730 | $303,200 | $51,800 | $251,400 |
| 2015 | $5,336 | $303,200 | $51,800 | $251,400 |
| 2014 | $5,336 | $303,200 | $51,800 | $251,400 |
| 2013 | $4,535 | $265,200 | $36,600 | $228,600 |
Source: Public Records
Map
Nearby Homes
- 74 Second St Unit A
- 74 2nd St Unit 1
- 61 Second St
- 89 Water St Unit 2
- 15 Middle St Unit 3
- 2 Warren St
- 7 Spring St
- 17 Union St
- 19 Union St
- 10 Summer St
- 9 Summer St
- Lot 21 Acorn Ln Unit 21
- Lot 20 Acorn Ln Unit 20
- Lot 23 Acorn Ln Unit 23
- 0 Winthrop Street Map 6 Lot 15
- 85 Middle St Unit 10
- 85 Middle St Unit 7
- 1 Bridge St
- Lot #14 Overlook Dr
- 11 Overlook Dr Unit 11
Your Personal Tour Guide
Ask me questions while you tour the home.