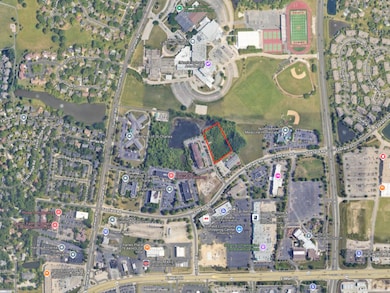
740 Courtyard Dr St. Charles, IL 60174
Northeast Saint Charles NeighborhoodEstimated payment $7,479/month
About This Lot
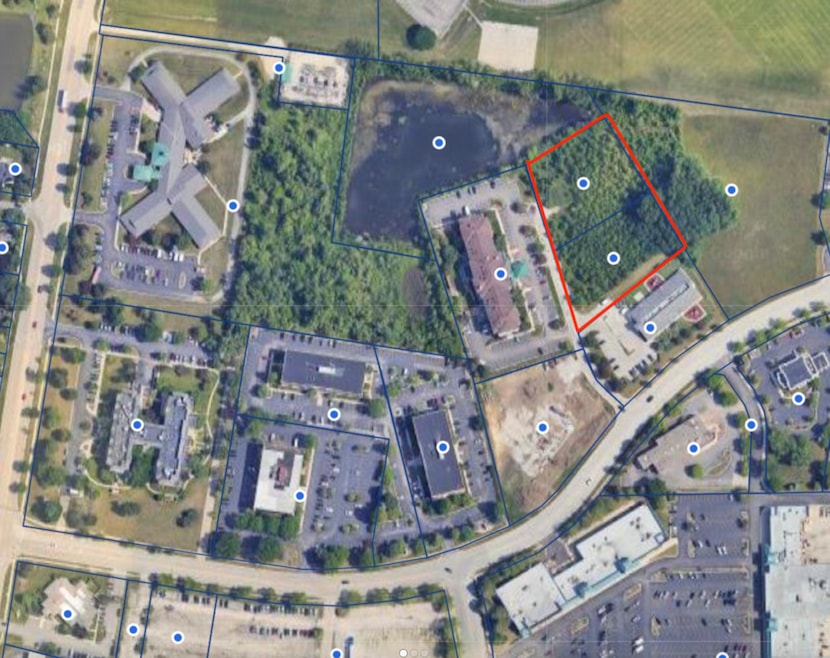
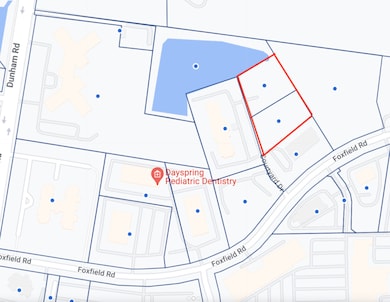
Explore this prime general commercial lot in St. Charles! Conveniently located near major transportation routes, retail, and commercial centers, this property is part of the Foxfield Commons PUD (Ord. No. 1991-Z-4). Zoned PUD O-R (Office/Research), the offering includes two parcels totaling 2.05 acres. Bring your own developer - or work with ours to bring your vision to life!
Property Details
Property Type
- Land
Est. Annual Taxes
- $24,685
Lot Details
- 2.05 Acre Lot
- Lot Dimensions are 327.2x270.7x370.3x202.4
- Additional Parcels
- Property is zoned COMMR
Map
Home Values in the Area
Average Home Value in this Area
Tax History
| Year | Tax Paid | Tax Assessment Tax Assessment Total Assessment is a certain percentage of the fair market value that is determined by local assessors to be the total taxable value of land and additions on the property. | Land | Improvement |
|---|---|---|---|---|
| 2024 | $12,282 | $165,460 | $165,460 | -- |
| 2023 | $11,852 | $148,089 | $148,089 | -- |
| 2022 | $11,911 | $147,524 | $147,524 | $0 |
| 2021 | $11,469 | $140,620 | $140,620 | $0 |
| 2020 | $11,357 | $137,998 | $137,998 | $0 |
| 2019 | $11,164 | $135,266 | $135,266 | $0 |
| 2018 | $10,660 | $128,515 | $128,515 | $0 |
| 2017 | $10,400 | $124,121 | $124,121 | $0 |
| 2016 | $10,941 | $119,762 | $119,762 | $0 |
| 2015 | -- | $118,471 | $118,471 | $0 |
| 2014 | -- | $118,471 | $118,471 | $0 |
| 2013 | -- | $119,656 | $119,656 | $0 |
Property History
| Date | Event | Price | List to Sale | Price per Sq Ft |
|---|---|---|---|---|
| 10/15/2025 10/15/25 | For Sale | $999,999 | -- | -- |
Purchase History
We collect this data history from publicly available records. To have your information removed, we recommend requesting removal directly through your county’s website.
| Date | Type | Sale Price | Title Company |
|---|---|---|---|
| Deed | $700,000 | Chicago Title Insurance Comp | |
| Deed | $675,000 | Chicago Title Insurance Co |
Mortgage History
We collect this data history from publicly available records. To have your information removed, we recommend requesting removal directly through your county’s website.
| Date | Status | Loan Amount | Loan Type |
|---|---|---|---|
| Closed | $650,000 | Commercial | |
| Previous Owner | $532,000 | Commercial |
Source: Midwest Real Estate Data (MRED)
MLS Number: 12496443
APN: 09-25-103-005
Disclaimer: Certain information contained herein is derived from information provided by parties other than Homes.com. All information provided is deemed reliable, but is not guaranteed to be accurate and should be independently verified.
![]() All data is obtained from various sources and may not have been verified by broker or MLS GRID. Supplied Open House Information is subject to change without notice. All information should be independently reviewed and verified for accuracy. Properties may or may not be listed by the office/agent presenting the information. Some IDX listings have been excluded from this website.
All data is obtained from various sources and may not have been verified by broker or MLS GRID. Supplied Open House Information is subject to change without notice. All information should be independently reviewed and verified for accuracy. Properties may or may not be listed by the office/agent presenting the information. Some IDX listings have been excluded from this website.
Listings courtesy of Midwest Real Estate Data (MRED) as distributed by MLS GRID.
Based on information submitted to the MLS GRID
- 831 Stuarts Dr Unit 831
- 710 Riding Ln Unit 183
- 504 Pin Oak Ct
- 1919 Waverly Cir
- 2012 Waverly Cir
- 264 Charlestowne Lake Dr
- 268 Charlestowne Lake Dr
- 270 Charlestowne Lake Dr
- 262 Charlestowne Lakes Dr
- 260 Charlestowne Lakes Dr
- 272 Charlestowne Lake Dr
- 264 Charlestowne Lakes Dr
- 266 Charlestowne Lakes Dr
- 268 Charlestowne Lakes Dr
- 270 Charlestowne Lakes Dr
- 272 Charlestowne Lakes Dr
- 274 Charlestowne Lakes Dr
- 1309 Hawkins Ct
- 263 Canal Dr
- 267 Canal Dr
- 717 Stuarts Dr Unit 22
- 318 Dunham Place Commons Unit 318
- 100 Lakeside Dr
- 201 N Tyler Rd
- 59 Whittington Course Unit 2
- 405 Smith Rd
- 4019 Faith Ln
- 863 Pheasant Trail
- 325 Delnor Glen Dr Unit 325
- 1000-1100 Geneva Rd
- 202 W Main St
- 222 State St
- 115 N 5th St Unit Upper
- 113 S 6th St Unit Upper
- 206 N 9th St Unit SI ID1285025P
- 916-920-920 Dean St Unit SI ID1285029P
- 12 Simpson St Unit A
- 201 N 15th St
- 1690-1821 Covington Ct
- 145 Walnut Dr

Ask me questions while you tour the home.