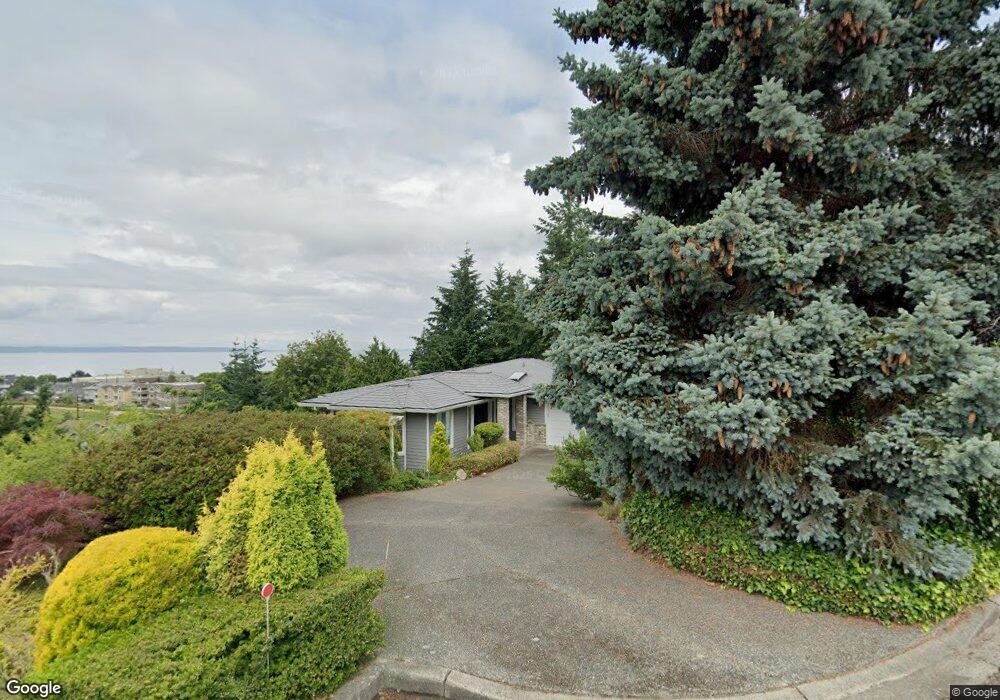
741 Edmonds St Edmonds, WA 98020
Edmonds Bowl NeighborhoodEstimated Value: $2,016,000 - $2,632,000
About This Home
This home is located at 741 Edmonds St, Edmonds, WA 98020 and is currently estimated at $2,409,780, approximately $610 per square foot. 741 Edmonds St is a home located in Snohomish County with nearby schools including Edmonds Elementary School, College Place Middle School, and Edmonds-Woodway High School.
Ownership History
We collect this data history from publicly available records. To have your information removed, we recommend requesting removal directly through your county’s website.
Purchase Details
Purchase Details
Purchase Details
Purchase Details
Home Values in the Area
Average Home Value in this Area
Purchase History
We collect this data history from publicly available records. To have your information removed, we recommend requesting removal directly through your county’s website.
| Date | Buyer | Sale Price | Title Company |
|---|---|---|---|
| -- | None Available | ||
| -- | None Available | ||
| $850,280 | Old Republic Title Ltd | ||
| -- | -- |
Tax History
We collect this data history from publicly available records. To have your information removed, we recommend requesting removal directly through your county’s website.
| Year | Tax Paid | Tax Assessment Tax Assessment Total Assessment is a certain percentage of the fair market value that is determined by local assessors to be the total taxable value of land and additions on the property. | Land | Improvement |
|---|---|---|---|---|
| 2026 | $16,874 | $2,462,900 | $1,821,200 | $641,700 |
| 2025 | $16,919 | $2,377,000 | $1,767,100 | $609,900 |
| 2024 | $16,919 | $2,377,900 | $1,629,900 | $748,000 |
| 2023 | $15,234 | $2,218,700 | $1,481,800 | $736,900 |
| 2022 | $13,560 | $1,623,700 | $1,002,700 | $621,000 |
| 2020 | $12,412 | $1,329,200 | $797,500 | $531,700 |
| 2019 | $11,884 | $1,281,900 | $760,500 | $521,400 |
| 2018 | $12,155 | $1,132,800 | $665,800 | $467,000 |
| 2017 | $10,719 | $1,045,200 | $602,200 | $443,000 |
| 2016 | $9,232 | $891,900 | $466,900 | $425,000 |
| 2015 | $9,174 | $834,500 | $431,500 | $403,000 |
| 2013 | $7,582 | $650,400 | $325,500 | $324,900 |
Map
- 812 Main St
- 103 8th Ave S
- 603 7th Ave N Unit A201
- 603 7th Ave N Unit A204
- 609 7th Ave N Unit B304
- 600 Bell St Unit 301
- 750 Maple St
- 1010 Main St
- 944 Maple St
- 618 Alder St
- 116 4th Ave N
- 631 Giltner Ln
- 816 Walnut St
- 932 Alder St
- 300 2nd Ave N Unit 2E
- 300 2nd Ave N Unit 2H
- 545 Holly Dr
- 1021 Walnut St
- 111 Main St Unit 203
- 200 James St Unit 307
Ask me questions while you tour the home.