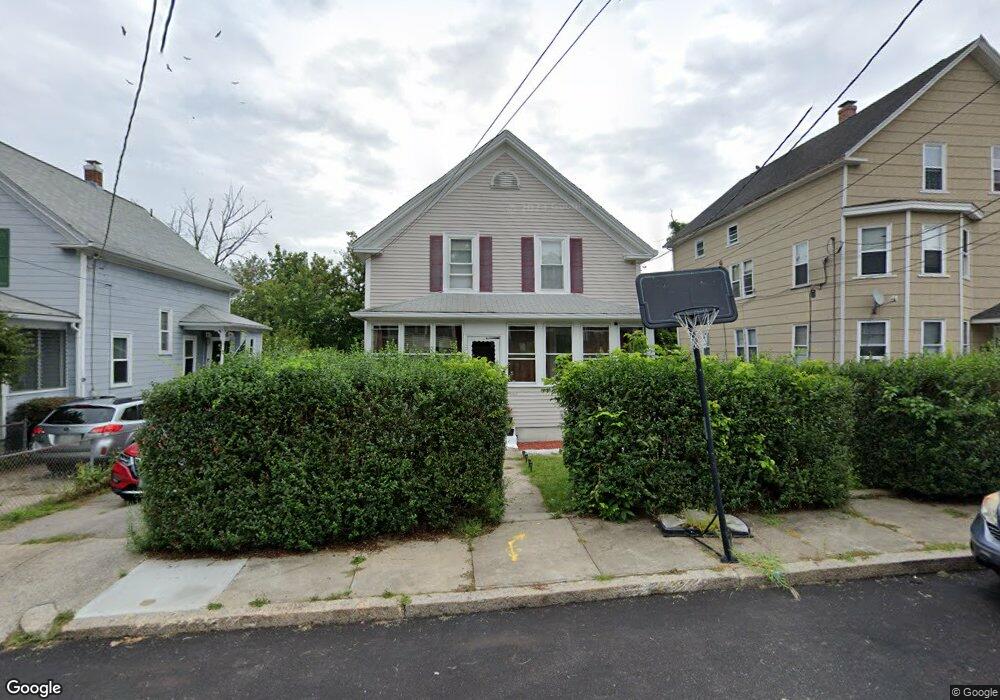
743 3rd Ave Woonsocket, RI 02895
Fairmount NeighborhoodEstimated Value: $354,894 - $394,000
4
Beds
1
Bath
1,404
Sq Ft
$265/Sq Ft
Est. Value
About This Home
This home is located at 743 3rd Ave, Woonsocket, RI 02895 and is currently estimated at $372,224, approximately $265 per square foot. 743 3rd Ave is a home located in Providence County with nearby schools including Woonsocket High School, Rise Prep Mayoral Academy Middle School, and Rise Prep Mayoral Academy.
Ownership History
Date
Name
Owned For
Owner Type
Purchase Details
Closed on
May 1, 2006
Sold by
Dugas Erin G and Dugas Douglas
Bought by
Faberlle Pedro A and Faberlle Lydia E
Current Estimated Value
Home Financials for this Owner
Home Financials are based on the most recent Mortgage that was taken out on this home.
Original Mortgage
$190,400
Outstanding Balance
$109,063
Interest Rate
6.4%
Mortgage Type
Purchase Money Mortgage
Estimated Equity
$263,161
Purchase Details
Closed on
Jul 3, 2001
Sold by
Cirka Walter T and Cirka Germaine M
Bought by
Dugas Douglas and Dugas Erin G
Create a Home Valuation Report for This Property
The Home Valuation Report is an in-depth analysis detailing your home's value as well as a comparison with similar homes in the area
Home Values in the Area
Average Home Value in this Area
Purchase History
| Date | Buyer | Sale Price | Title Company |
|---|---|---|---|
| Faberlle Pedro A | $238,000 | -- | |
| Dugas Douglas | $100,000 | -- | |
| Faberlle Pedro A | $238,000 | -- | |
| Dugas Douglas | $100,000 | -- |
Source: Public Records
Mortgage History
| Date | Status | Borrower | Loan Amount |
|---|---|---|---|
| Open | Dugas Douglas | $190,400 | |
| Closed | Dugas Douglas | $47,600 | |
| Closed | Dugas Douglas | $190,400 |
Source: Public Records
Tax History
| Year | Tax Paid | Tax Assessment Tax Assessment Total Assessment is a certain percentage of the fair market value that is determined by local assessors to be the total taxable value of land and additions on the property. | Land | Improvement |
|---|---|---|---|---|
| 2025 | $3,738 | $332,900 | $104,500 | $228,400 |
| 2024 | $3,804 | $261,600 | $92,700 | $168,900 |
| 2023 | $3,657 | $261,600 | $92,700 | $168,900 |
| 2022 | $3,657 | $261,600 | $92,700 | $168,900 |
| 2021 | $3,653 | $153,800 | $56,600 | $97,200 |
| 2020 | $3,691 | $153,800 | $56,600 | $97,200 |
| 2018 | $3,704 | $153,800 | $56,600 | $97,200 |
| 2017 | $3,720 | $123,600 | $45,600 | $78,000 |
| 2016 | $3,935 | $123,600 | $45,600 | $78,000 |
| 2015 | $4,521 | $123,600 | $45,600 | $78,000 |
| 2014 | $2,935 | $119,800 | $50,100 | $69,700 |
Source: Public Records
Map
Nearby Homes
- 29 Graves Ave
- 217 4th Ave
- 60 Fairlawn Ave
- 36 Fairmount St
- 154 156 Winter St
- 81 Fountain St
- 123 4th Ave
- 10 Huntington Ave
- 83 4th Ave
- 0 10th Ave
- 10 10th Ave
- 52 Mendon Rd
- 84 Saint Paul St
- 0 Mendon Rd Unit 1406977
- 11 Federal St
- 164 W School St
- 187 Boyden St
- 107 Blackstone St
- 115 Railroad St
- 0 Holbrook Ln Unit 1402850
Your Personal Tour Guide
Ask me questions while you tour the home.