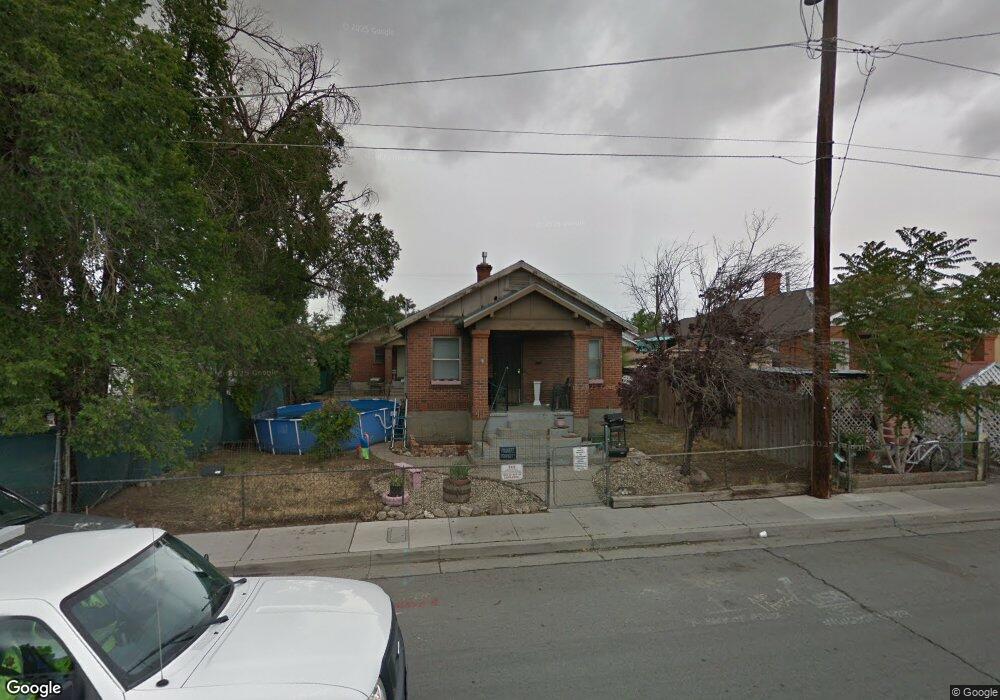
745 E 2nd St Reno, NV 89502
MidTown NeighborhoodEstimated Value: $396,000 - $572,000
3
Beds
2
Baths
1,413
Sq Ft
$366/Sq Ft
Est. Value
About This Home
This home is located at 745 E 2nd St, Reno, NV 89502 and is currently estimated at $517,106, approximately $365 per square foot. 745 E 2nd St is a home located in Washoe County with nearby schools including Libby C Booth Elementary School, Vaughn Middle School, and Earl Wooster High School.
Ownership History
Date
Name
Owned For
Owner Type
Purchase Details
Closed on
Oct 22, 2024
Sold by
Midtown Units Llc
Bought by
Midtown Units-Series 74 Llc
Current Estimated Value
Purchase Details
Closed on
Jul 1, 2014
Sold by
Hudgens Robert L and Hudgens June E
Bought by
Midtown Units Llc
Purchase Details
Closed on
Aug 31, 2012
Sold by
Hudgens Robert L and Hudgens June E
Bought by
Hudgens Robert L and Hudgens June E
Create a Home Valuation Report for This Property
The Home Valuation Report is an in-depth analysis detailing your home's value as well as a comparison with similar homes in the area
Home Values in the Area
Average Home Value in this Area
Purchase History
| Date | Buyer | Sale Price | Title Company |
|---|---|---|---|
| Midtown Units-Series 74 Llc | -- | None Listed On Document | |
| Midtown Units-Series 74 Llc | -- | None Listed On Document | |
| Midtown Units Llc | -- | None Available | |
| Hudgens Robert L | -- | None Available | |
| Hudgens Robert L | -- | None Available |
Source: Public Records
Tax History
| Year | Tax Paid | Tax Assessment Tax Assessment Total Assessment is a certain percentage of the fair market value that is determined by local assessors to be the total taxable value of land and additions on the property. | Land | Improvement |
|---|---|---|---|---|
| 2026 | $1,081 | $84,516 | $55,195 | $29,321 |
| 2025 | $1,416 | $83,997 | $55,195 | $28,802 |
| 2024 | $1,416 | $83,832 | $55,195 | $28,637 |
| 2023 | $1,310 | $83,906 | $57,505 | $26,401 |
| 2022 | $1,215 | $67,896 | $45,675 | $22,221 |
| 2021 | $1,127 | $52,333 | $31,465 | $20,868 |
| 2020 | $1,092 | $47,786 | $26,950 | $20,836 |
| 2019 | $1,043 | $45,419 | $25,690 | $19,729 |
| 2018 | $987 | $36,241 | $18,200 | $18,041 |
| 2017 | $952 | $28,923 | $11,060 | $17,863 |
| 2016 | $921 | $28,158 | $10,430 | $17,728 |
| 2015 | $694 | $28,029 | $10,430 | $17,599 |
| 2014 | $896 | $24,634 | $7,840 | $16,794 |
| 2013 | -- | $23,363 | $7,000 | $16,363 |
Source: Public Records
Map
Nearby Homes
- 627 E 2nd St
- 101 S Wells Ave
- 831 Ryland St
- 330 Stewart St
- 446 Roberts St
- 536 Sinclair St
- 521 Lake St
- 962 Roberts St
- 998 Roberts St
- 440 E 7th St
- 442 E 7th St Unit 1 & 2
- 1020 Roberts St
- 344 E 7th St
- 336 E 7th St
- 50 N Sierra St Unit 601
- 50 N Sierra St Unit 909
- 50 N Sierra St Unit 805
- 50 N Sierra St Unit 910
- 50 N Sierra St Unit 903
- 127 Cheney St
Your Personal Tour Guide
Ask me questions while you tour the home.