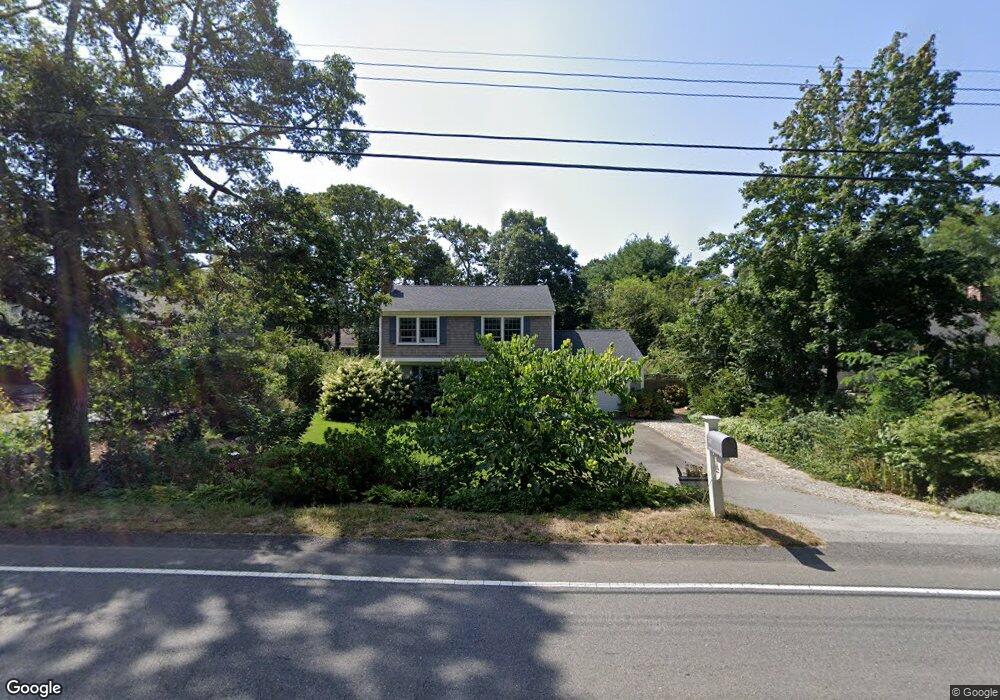
747 Queen Anne Rd Harwich, MA 02645
East Harwich NeighborhoodEstimated Value: $620,575 - $705,000
3
Beds
2
Baths
1,450
Sq Ft
$465/Sq Ft
Est. Value
About This Home
This home is located at 747 Queen Anne Rd, Harwich, MA 02645 and is currently estimated at $674,644, approximately $465 per square foot. 747 Queen Anne Rd is a home located in Barnstable County with nearby schools including Harwich Elementary School, Chatham Elementary School, and Monomoy Regional Middle School.
Ownership History
Date
Name
Owned For
Owner Type
Purchase Details
Closed on
Nov 1, 2005
Sold by
Williamson Arnold and Williamson Christine L
Bought by
Lydon Joseph and Lydon Katherine E
Current Estimated Value
Home Financials for this Owner
Home Financials are based on the most recent Mortgage that was taken out on this home.
Original Mortgage
$275,000
Interest Rate
5.79%
Mortgage Type
Purchase Money Mortgage
Create a Home Valuation Report for This Property
The Home Valuation Report is an in-depth analysis detailing your home's value as well as a comparison with similar homes in the area
Home Values in the Area
Average Home Value in this Area
Purchase History
| Date | Buyer | Sale Price | Title Company |
|---|---|---|---|
| Lydon Joseph | $345,000 | -- | |
| Lydon Joseph | $345,000 | -- |
Source: Public Records
Mortgage History
| Date | Status | Borrower | Loan Amount |
|---|---|---|---|
| Open | Lydon Joseph | $258,000 | |
| Closed | Lydon Joseph | $275,000 |
Source: Public Records
Tax History
| Year | Tax Paid | Tax Assessment Tax Assessment Total Assessment is a certain percentage of the fair market value that is determined by local assessors to be the total taxable value of land and additions on the property. | Land | Improvement |
|---|---|---|---|---|
| 2025 | $3,117 | $527,400 | $159,700 | $367,700 |
| 2024 | $3,228 | $535,400 | $188,300 | $347,100 |
| 2023 | $3,117 | $469,400 | $171,200 | $298,200 |
| 2022 | $3,049 | $375,900 | $148,900 | $227,000 |
| 2021 | $2,927 | $340,400 | $135,300 | $205,100 |
| 2020 | $2,883 | $330,200 | $132,500 | $197,700 |
| 2019 | $2,761 | $318,400 | $125,700 | $192,700 |
| 2018 | $2,166 | $239,000 | $114,200 | $124,800 |
| 2017 | $2,346 | $261,500 | $94,600 | $166,900 |
| 2016 | $2,289 | $252,400 | $94,600 | $157,800 |
| 2015 | $2,225 | $248,000 | $92,800 | $155,200 |
| 2014 | $2,112 | $240,800 | $90,000 | $150,800 |
Source: Public Records
Map
Nearby Homes
- 15 Quail Nest Run
- 63 Idle Way
- 4 Skipper Shea Ln
- 3 Freshwater Rd
- 1157 Orleans-Harwich Rd
- 10 Middle Rd
- 16 Turtle Run
- 1025 Orleans-Harwich Rd
- 26 Walkerwoods Dr
- 19 Walkerwoods Dr
- L261 Queen Anne Rd
- 23 Dundee Cir
- 10 Brian Way
- 13 Harwich Pines
- 54 Marthas Ln
- 58 Marthas Ln
- 15 Elijah's Woods
- 36 Lakewood Dr
- 0 Tirrells Way
- 58 Tirrells Way
- 749 Queen Anne Rd
- 743 Queen Anne Rd
- 32 Vacation Ln
- 753 Queen Anne Rd
- 26 Vacation Ln
- 36 Vacation Ln
- 739 Queen Anne Rd
- 40 Vacation Ln
- 22 Vacation Ln
- 757 Queen Anne Rd
- 737 Queen Anne Rd
- 46 Vacation Ln
- 2 Oyster Pond Rd
- 20 Vacation Ln
- 759 Queen Anne Rd
- 52 Vacation Ln
- 738 Queen Anne Rd
- 27 Vacation Ln
- 35 Vacation Ln
- 31 Vacation Ln
Your Personal Tour Guide
Ask me questions while you tour the home.