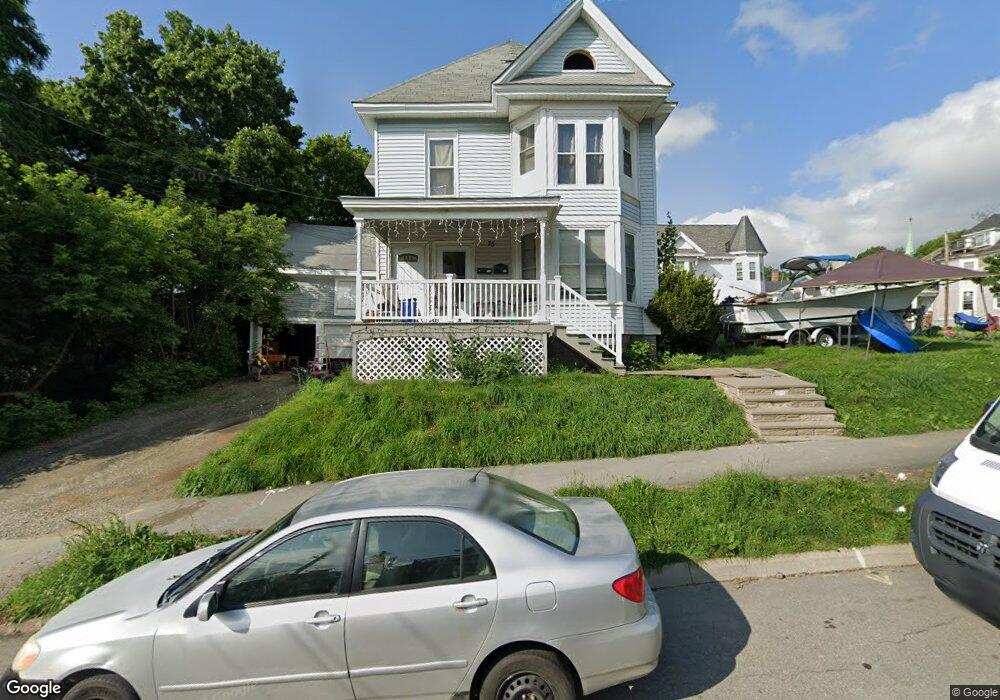
75 Cedar St Bangor, ME 04401
West Bangor NeighborhoodEstimated Value: $238,551 - $286,000
5
Beds
2
Baths
2,232
Sq Ft
$116/Sq Ft
Est. Value
About This Home
This home is located at 75 Cedar St, Bangor, ME 04401 and is currently estimated at $258,888, approximately $115 per square foot. 75 Cedar St is a home located in Penobscot County with nearby schools including Vine Street School, Fairmount School, and James F. Doughty School.
Ownership History
Date
Name
Owned For
Owner Type
Purchase Details
Closed on
Jul 16, 2009
Sold by
A I M Re Investments Llc
Bought by
King Elizabeth M
Current Estimated Value
Home Financials for this Owner
Home Financials are based on the most recent Mortgage that was taken out on this home.
Original Mortgage
$119,790
Outstanding Balance
$78,183
Interest Rate
5.31%
Mortgage Type
FHA
Estimated Equity
$180,705
Create a Home Valuation Report for This Property
The Home Valuation Report is an in-depth analysis detailing your home's value as well as a comparison with similar homes in the area
Home Values in the Area
Average Home Value in this Area
Purchase History
| Date | Buyer | Sale Price | Title Company |
|---|---|---|---|
| King Elizabeth M | -- | -- |
Source: Public Records
Mortgage History
| Date | Status | Borrower | Loan Amount |
|---|---|---|---|
| Open | King Elizabeth M | $119,790 |
Source: Public Records
Tax History
| Year | Tax Paid | Tax Assessment Tax Assessment Total Assessment is a certain percentage of the fair market value that is determined by local assessors to be the total taxable value of land and additions on the property. | Land | Improvement |
|---|---|---|---|---|
| 2024 | $3,636 | $196,000 | $11,700 | $184,300 |
| 2023 | $3,428 | $179,000 | $11,700 | $167,300 |
| 2022 | $3,111 | $152,500 | $11,700 | $140,800 |
| 2021 | $2,977 | $133,500 | $10,900 | $122,600 |
| 2020 | $2,805 | $120,900 | $10,300 | $110,600 |
| 2019 | $2,680 | $116,500 | $10,300 | $106,200 |
| 2018 | $2,463 | $107,300 | $10,100 | $97,200 |
| 2017 | $2,269 | $100,300 | $9,200 | $91,100 |
| 2016 | $2,111 | $101,200 | $9,200 | $92,000 |
| 2015 | $2,221 | $101,200 | $9,200 | $92,000 |
| 2014 | $2,173 | $99,700 | $9,200 | $90,500 |
| 2013 | $1,980 | $95,200 | $8,900 | $86,300 |
Source: Public Records
Map
Nearby Homes
- 41-43 Second St
- 85/87 Cedar St
- 85 Cedar St
- 10 2nd Street Ave
- 87 Cedar St
- 67 Cedar St Unit 3
- 67 Cedar St Unit 1
- 82 Cedar St
- L46/9-2 Pine Tree Rd
- 46 2nd St Unit 1
- 34 Sanford St Unit 3
- 84 Cedar St
- 44 2nd St Unit 1
- 65 Cedar St Unit 1
- 65 Cedar St
- 32 Sanford St
- 36 Sanford St Unit 4
- 36 Sanford St Unit 6
- 59 Cedar St
- 66 Cedar St Unit 2
Your Personal Tour Guide
Ask me questions while you tour the home.