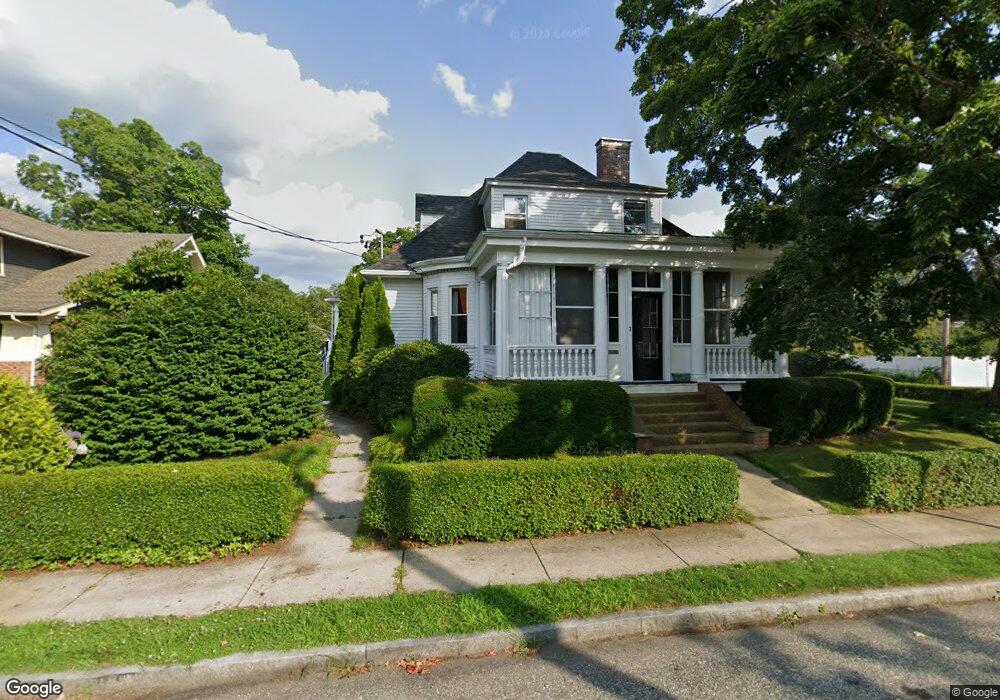
75 Crescent St Norwich, CT 06360
Central Norwich NeighborhoodEstimated Value: $372,000 - $562,329
5
Beds
4
Baths
3,562
Sq Ft
$130/Sq Ft
Est. Value
About This Home
This home is located at 75 Crescent St, Norwich, CT 06360 and is currently estimated at $464,832, approximately $130 per square foot. 75 Crescent St is a home located in New London County with nearby schools including Moriarty Magnet Elementary School, Kelly STEAM Magnet Middle School, and Integrated Day Charter School.
Ownership History
Date
Name
Owned For
Owner Type
Purchase Details
Closed on
Oct 27, 2005
Sold by
Bararossa Lucille and Bararossa Frank
Bought by
Karlsen Joan and Wylie Nicholas
Current Estimated Value
Home Financials for this Owner
Home Financials are based on the most recent Mortgage that was taken out on this home.
Original Mortgage
$280,000
Outstanding Balance
$144,586
Interest Rate
5.79%
Mortgage Type
Purchase Money Mortgage
Estimated Equity
$320,246
Create a Home Valuation Report for This Property
The Home Valuation Report is an in-depth analysis detailing your home's value as well as a comparison with similar homes in the area
Home Values in the Area
Average Home Value in this Area
Purchase History
| Date | Buyer | Sale Price | Title Company |
|---|---|---|---|
| Karlsen Joan | $350,000 | -- | |
| Karlsen Joan | $350,000 | -- |
Source: Public Records
Mortgage History
| Date | Status | Borrower | Loan Amount |
|---|---|---|---|
| Open | Karlsen Joan | $280,000 | |
| Closed | Karlsen Joan | $52,500 | |
| Closed | Karlsen Joan | $280,000 | |
| Previous Owner | Karlsen Joan | $280,000 |
Source: Public Records
Tax History
| Year | Tax Paid | Tax Assessment Tax Assessment Total Assessment is a certain percentage of the fair market value that is determined by local assessors to be the total taxable value of land and additions on the property. | Land | Improvement |
|---|---|---|---|---|
| 2025 | $10,348 | $255,700 | $34,400 | $221,300 |
| 2024 | $9,768 | $255,700 | $34,400 | $221,300 |
| 2023 | $6,586 | $135,400 | $24,300 | $111,100 |
| 2022 | $6,564 | $135,400 | $24,300 | $111,100 |
| 2021 | $6,586 | $135,400 | $24,300 | $111,100 |
| 2020 | $6,568 | $135,500 | $24,400 | $111,100 |
| 2019 | $6,503 | $135,500 | $24,400 | $111,100 |
| 2018 | $6,760 | $139,700 | $28,600 | $111,100 |
| 2017 | $6,809 | $139,700 | $28,600 | $111,100 |
| 2016 | $6,854 | $139,700 | $28,600 | $111,100 |
| 2015 | $6,714 | $139,700 | $28,600 | $111,100 |
| 2014 | $6,416 | $139,700 | $28,600 | $111,100 |
Source: Public Records
Map
Nearby Homes
- 10 Rockwell St
- 227 Broadway
- 78 Mckinley Ave
- 142 Broad St
- 63 Mckinley Ave
- 150 Yantic St Unit 213
- 150 Yantic St Unit 224
- 45 Mckinley Ave
- 185 Broadway
- 21 Buckingham Ave
- 110 Cedar St
- 15 Platt Ave
- 7 Mckinley Ave
- 14 Sturtevant Ave
- 40 Beech St
- 231 Broad St
- 73 Cedar St Unit B4
- 0 Vine St
- 254 Broad St
- 24 John St
- 5 Joseph Perkins Rd
- 67 Crescent St
- 7 Joseph Perkins Rd
- 269 Broadway
- 11 Joseph Perkins Rd
- 1 Coles Ct
- 34 Rockwell St
- 15 Joseph Perkins Rd
- 263 Broadway
- 3 Coles Ct
- 19 Joseph Perkins Rd
- 21 Joseph Perkins Rd
- 35 Chelsea Parade S
- 188 McKinley Avenue Extension
- 196 McKinley Avenue Extension
- 200 McKinley Avenue Extension
- 1 Rockwell Terrace
- 25 Joseph Perkins Rd
- 257 Broadway
- 206 McKinley Avenue Extension
Your Personal Tour Guide
Ask me questions while you tour the home.