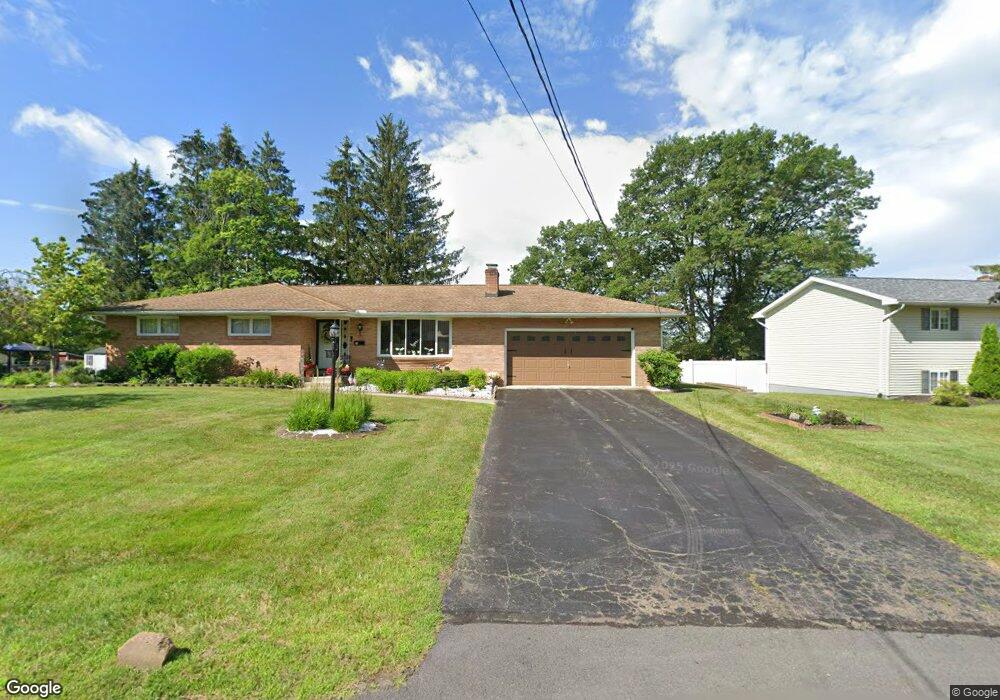
75 Deerpath Dr Mountain Top, PA 18707
Estimated Value: $281,000 - $353,000
3
Beds
2
Baths
1,463
Sq Ft
$214/Sq Ft
Est. Value
About This Home
This home is located at 75 Deerpath Dr, Mountain Top, PA 18707 and is currently estimated at $313,630, approximately $214 per square foot. 75 Deerpath Dr is a home located in Luzerne County with nearby schools including Crestwood Secondary Campus (Crestwood High School) and St Jude School.
Ownership History
Date
Name
Owned For
Owner Type
Purchase Details
Closed on
Jul 26, 2020
Sold by
Giza Stanley and Brown Linda
Bought by
Jones Patricia
Current Estimated Value
Home Financials for this Owner
Home Financials are based on the most recent Mortgage that was taken out on this home.
Original Mortgage
$189,393
Outstanding Balance
$165,720
Interest Rate
3%
Mortgage Type
New Conventional
Estimated Equity
$147,910
Purchase Details
Closed on
Mar 3, 2017
Sold by
Giza Stanley and Brown Linda
Bought by
Giza Stanley
Purchase Details
Closed on
May 24, 1973
Bought by
Giza Stanley and Giza Anna
Create a Home Valuation Report for This Property
The Home Valuation Report is an in-depth analysis detailing your home's value as well as a comparison with similar homes in the area
Home Values in the Area
Average Home Value in this Area
Purchase History
| Date | Buyer | Sale Price | Title Company |
|---|---|---|---|
| Jones Patricia | $187,500 | Centurion Abstract Inc | |
| Giza Stanley | -- | None Available | |
| Giza Stanley | $800 | -- |
Source: Public Records
Mortgage History
| Date | Status | Borrower | Loan Amount |
|---|---|---|---|
| Open | Jones Patricia | $189,393 |
Source: Public Records
Tax History
| Year | Tax Paid | Tax Assessment Tax Assessment Total Assessment is a certain percentage of the fair market value that is determined by local assessors to be the total taxable value of land and additions on the property. | Land | Improvement |
|---|---|---|---|---|
| 2026 | $3,874 | $182,600 | $27,000 | $155,600 |
| 2025 | $3,806 | $182,600 | $27,000 | $155,600 |
| 2024 | $3,743 | $182,600 | $27,000 | $155,600 |
| 2023 | $3,625 | $182,600 | $27,000 | $155,600 |
| 2022 | $3,592 | $182,600 | $27,000 | $155,600 |
| 2021 | $3,515 | $182,600 | $27,000 | $155,600 |
| 2020 | $3,300 | $182,600 | $27,000 | $155,600 |
| 2019 | $3,144 | $182,600 | $27,000 | $155,600 |
| 2018 | $3,045 | $182,600 | $27,000 | $155,600 |
| 2017 | $3,045 | $182,600 | $27,000 | $155,600 |
| 2016 | -- | $182,600 | $27,000 | $155,600 |
| 2015 | $2,664 | $182,600 | $27,000 | $155,600 |
| 2014 | $2,664 | $182,600 | $27,000 | $155,600 |
Source: Public Records
Map
Nearby Homes
- 19 Park Ln E
- 28 Harley Dr
- 11 Farmhouse Rd
- 67 Gracedale Ave
- 40 Farmhouse Rd
- 5 Taylor Cir
- 1 Taylor Cir
- 2 Taylor Cir
- 197 S Mountain Blvd
- 263 S Mountain Blvd
- Lot 150 Manor Dr
- Lot 155 Manor Dr
- Lot 154 Manor Dr
- Lot 149 Manor Dr
- Lot 151 Manor Dr
- 0 Aleksander Blvd
- 126 Patriot Cir
- 509 Ryan Way
- 1,2,3 Sans Souci Pkwy
- 426 Mitchell Ave Unit 65
Your Personal Tour Guide
Ask me questions while you tour the home.