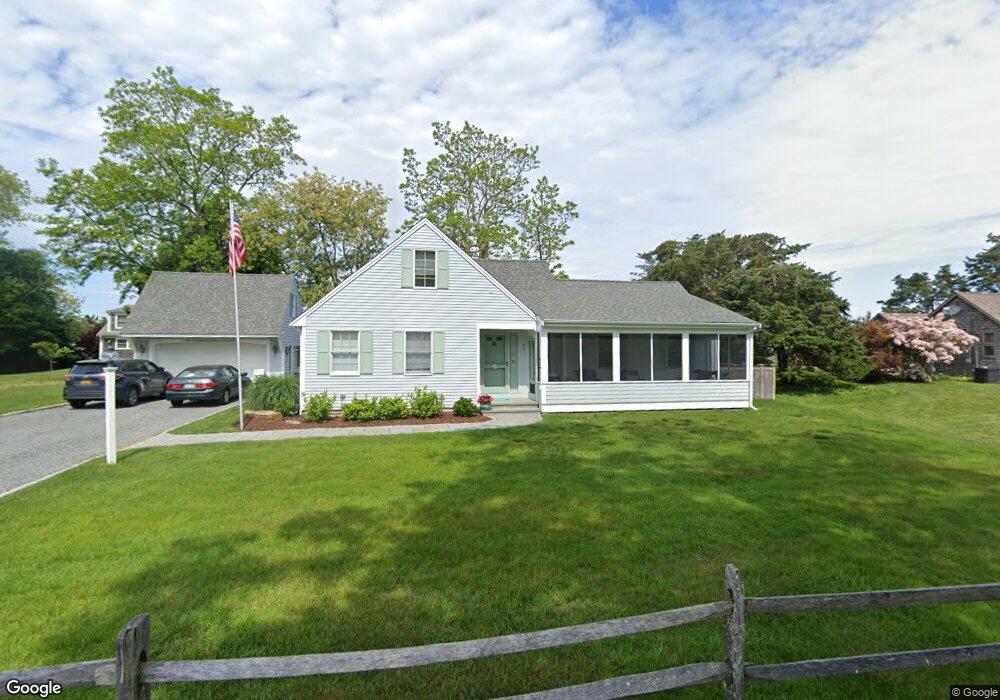
75 Harvey Ave Barnstable, MA 02630
Barnstable Village NeighborhoodEstimated Value: $1,131,000 - $1,718,000
2
Beds
2
Baths
1,831
Sq Ft
$718/Sq Ft
Est. Value
About This Home
This home is located at 75 Harvey Ave, Barnstable, MA 02630 and is currently estimated at $1,315,333, approximately $718 per square foot. 75 Harvey Ave is a home located in Barnstable County with nearby schools including West Barnstable Elementary School, Barnstable United Elementary School, and Barnstable Intermediate School.
Ownership History
Date
Name
Owned For
Owner Type
Purchase Details
Closed on
Nov 3, 2015
Sold by
Ruggiero Janet
Bought by
Campagnolo Kristin
Current Estimated Value
Purchase Details
Closed on
Feb 26, 2014
Sold by
Henning Frederiksen Re
Bought by
Ruggerio Janet
Purchase Details
Closed on
Feb 19, 2014
Sold by
Frederiksen Henning J
Bought by
Henning Frederiksenn R
Create a Home Valuation Report for This Property
The Home Valuation Report is an in-depth analysis detailing your home's value as well as a comparison with similar homes in the area
Home Values in the Area
Average Home Value in this Area
Purchase History
We collect this data history from publicly available records. To have your information removed, we recommend requesting removal directly through your county’s website.
| Date | Buyer | Sale Price | Title Company |
|---|---|---|---|
| Campagnolo Kristin | -- | -- | |
| Ruggerio Janet | -- | -- | |
| Henning Frederiksenn R | -- | -- |
Source: Public Records
Tax History
| Year | Tax Paid | Tax Assessment Tax Assessment Total Assessment is a certain percentage of the fair market value that is determined by local assessors to be the total taxable value of land and additions on the property. | Land | Improvement |
|---|---|---|---|---|
| 2025 | $10,080 | $1,090,900 | $591,300 | $499,600 |
| 2024 | $11,281 | $1,287,800 | $813,000 | $474,800 |
| 2023 | $9,819 | $1,093,400 | $671,900 | $421,500 |
| 2022 | $8,138 | $729,200 | $438,000 | $291,200 |
| 2021 | $7,367 | $629,100 | $398,200 | $230,900 |
| 2020 | $7,636 | $622,800 | $398,200 | $224,600 |
| 2019 | $7,528 | $616,000 | $418,100 | $197,900 |
| 2018 | $7,150 | $568,400 | $398,200 | $170,200 |
| 2017 | $6,974 | $557,900 | $398,200 | $159,700 |
| 2016 | $6,918 | $561,100 | $402,800 | $158,300 |
| 2015 | $6,541 | $540,100 | $385,700 | $154,400 |
Source: Public Records
Map
Nearby Homes
- 30 Indian Trail
- 55 Tonela Ln
- 22 Kent Rd
- 0 Indian Trail
- 79 Bayberry Ln
- 122 Salt Rock Rd
- 284 Braggs Ln
- 124 Old Jail Ln
- 320 Braggs Ln
- 79 Sturgis Ln
- 280 Harbor Point Rd
- 12 van Duzer Rd Unit 8
- 44 Iris Ln
- 93 Harris Meadow Ln
- 4332 Main St
- 170 Althea Dr
- 218 Oakmont Rd
- 153 Oakmont Dr
- 64 Wingfoot Dr
- 4390 Main St
Your Personal Tour Guide
Ask me questions while you tour the home.