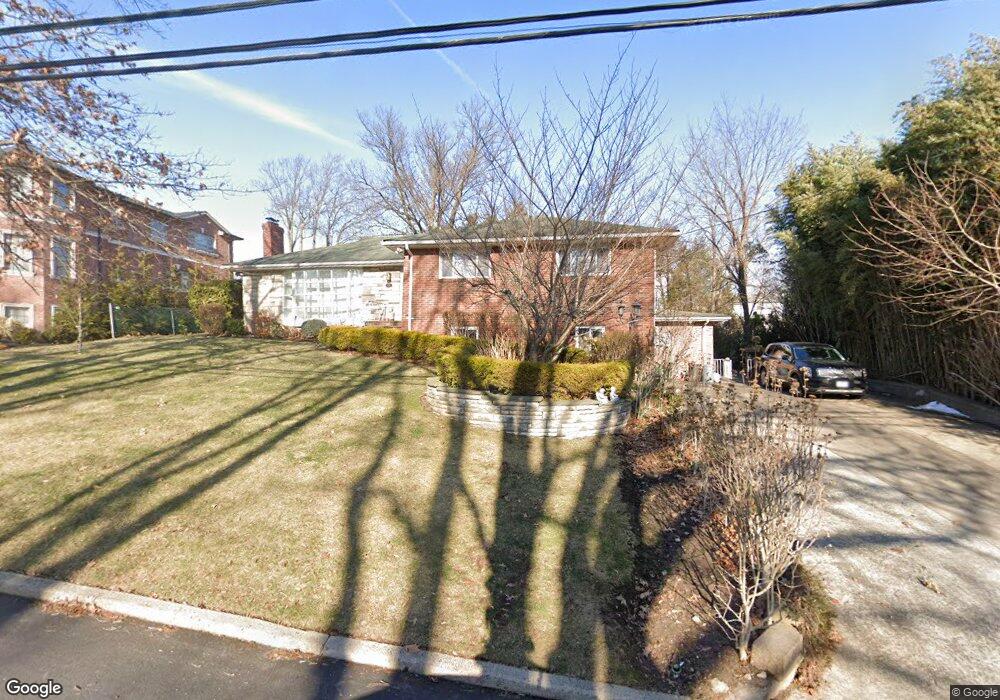
75 John St Englewood Cliffs, NJ 07632
Estimated Value: $1,252,000 - $1,417,000
Studio
--
Bath
2,561
Sq Ft
$521/Sq Ft
Est. Value
About This Home
This home is located at 75 John St, Englewood Cliffs, NJ 07632 and is currently estimated at $1,335,226, approximately $521 per square foot. 75 John St is a home located in Bergen County with nearby schools including North Cliff Elementary School, Upper School Elementary School, and Englewood on the Palisades Charter School.
Ownership History
Date
Name
Owned For
Owner Type
Purchase Details
Closed on
Sep 6, 2006
Sold by
Chin Enna Chi Ying
Bought by
Koh Yong Ha and Chae Oak Koh
Current Estimated Value
Home Financials for this Owner
Home Financials are based on the most recent Mortgage that was taken out on this home.
Original Mortgage
$703,600
Outstanding Balance
$425,294
Interest Rate
6.79%
Estimated Equity
$909,932
Purchase Details
Closed on
Jul 22, 1998
Sold by
Chin Shiu Woo and Chin Susanna Yuen
Bought by
Chin Enna Chi Ying
Home Financials for this Owner
Home Financials are based on the most recent Mortgage that was taken out on this home.
Original Mortgage
$250,000
Interest Rate
6.92%
Create a Home Valuation Report for This Property
The Home Valuation Report is an in-depth analysis detailing your home's value as well as a comparison with similar homes in the area
Home Values in the Area
Average Home Value in this Area
Purchase History
We collect this data history from publicly available records. To have your information removed, we recommend requesting removal directly through your county’s website.
| Date | Buyer | Sale Price | Title Company |
|---|---|---|---|
| Koh Yong Ha | $879,500 | -- | |
| Chin Enna Chi Ying | $450,000 | -- |
Source: Public Records
Mortgage History
We collect this data history from publicly available records. To have your information removed, we recommend requesting removal directly through your county’s website.
| Date | Status | Borrower | Loan Amount |
|---|---|---|---|
| Open | Koh Yong Ha | $703,600 | |
| Previous Owner | Chin Enna Chi Ying | $250,000 |
Source: Public Records
Tax History
| Year | Tax Paid | Tax Assessment Tax Assessment Total Assessment is a certain percentage of the fair market value that is determined by local assessors to be the total taxable value of land and additions on the property. | Land | Improvement |
|---|---|---|---|---|
| 2025 | $9,969 | $863,100 | $702,800 | $160,300 |
| 2024 | $9,848 | $863,100 | $702,800 | $160,300 |
| 2023 | $9,693 | $863,100 | $702,800 | $160,300 |
| 2022 | $9,693 | $863,100 | $702,800 | $160,300 |
| 2021 | $7,451 | $863,100 | $702,800 | $160,300 |
| 2020 | $9,934 | $863,100 | $702,800 | $160,300 |
| 2019 | $9,330 | $863,100 | $702,800 | $160,300 |
| 2018 | $9,002 | $863,100 | $702,800 | $160,300 |
| 2017 | $8,614 | $863,100 | $702,800 | $160,300 |
| 2016 | $8,450 | $863,100 | $702,800 | $160,300 |
| 2015 | $8,027 | $863,100 | $702,800 | $160,300 |
| 2014 | $7,509 | $863,100 | $702,800 | $160,300 |
Source: Public Records
Map
Nearby Homes
Your Personal Tour Guide
Ask me questions while you tour the home.