S
Seller's Agent in 2026
Susan Sinnett
RE/MAX
(207) 650-7863
1 in this area
12 Total Sales

Estimated Value: $630,000 - $655,000
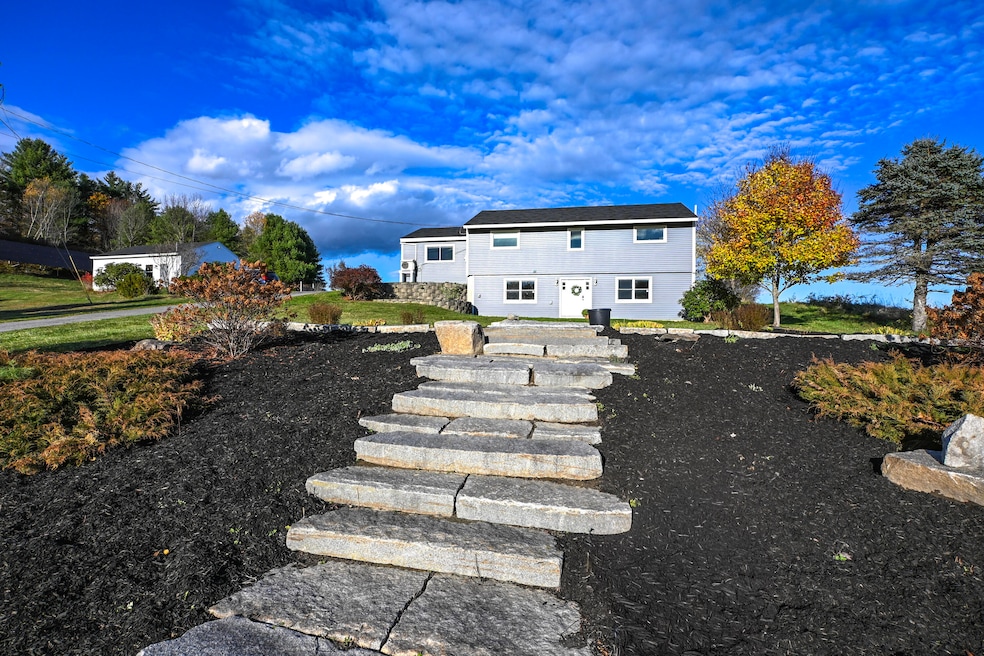
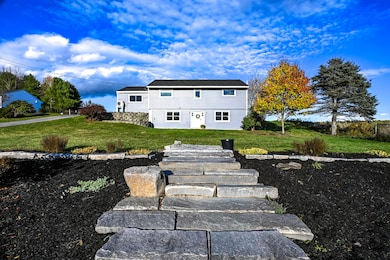
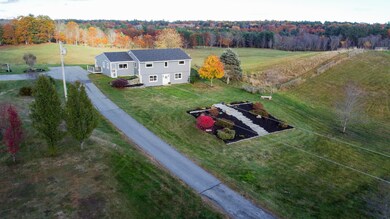
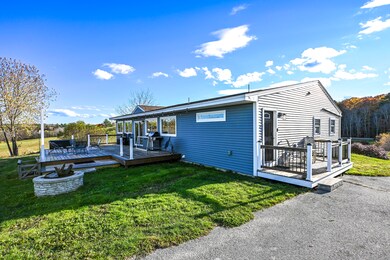
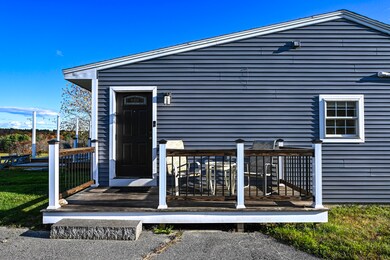
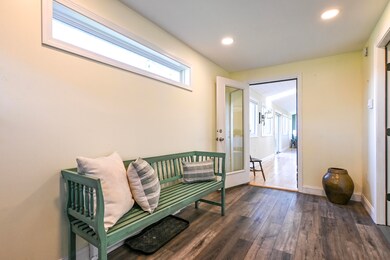
Escape to a home that blends sustainability, comfort, and natural beauty. This captivating 3-bedroom, 2.5-bath residence offers 2,235 sq. ft. of light-filled living space designed for modern living. Powered entirely by the sun, the impressive solar panel and battery system provides up to two days of stored energy, while efficient heat pumps deliver year-round comfort—eliminating heating and electric bills altogether. A brand-new well adds peace of mind, and recent basement improvements enhance both functionality and flexibility. Step inside to a welcoming open layout where the family room's cathedral ceiling and wall of windows frame sweeping views of the surrounding meadow. The inviting living and dining areas create a comfortable flow for everyday living and entertaining. The kitchen, with a large window overlooking the tranquil pond and perennial gardens, offers an inspiring setting for daily life. Three comfortable bedrooms include a spacious primary suite with soaring ceilings, exposed beams, and peaceful views of the natural landscape. The finished lower level features a new full bathroom, bedroom, workout area, and office—making it ideal for an in-law apartment, guest suite, or potential rental space. The new full bathroom is fully permitted and will be completed prior to closing. Outdoors, the property's setting captures the best of Maine's beauty. On one side, a serene pond stocked with catfish and bass and visited by turtles, herons, and frogs provides a peaceful retreat. On the other, open meadow views and visiting deer and songbirds create a true connection to nature. Located just four miles from downtown Gorham, this property offers the best of both worlds—an idyllic, private setting with the conveniences of town within easy reach. Enjoy a lifestyle that harmonizes with nature while providing the modern comforts of a thoughtfully upgraded home. OPEN HOUSE Sunday 12-2
We collect this data history from publicly available records. To have your information removed, we recommend requesting removal directly through your county’s website.
We collect this data history from publicly available records. To have your information removed, we recommend requesting removal directly through your county’s website.
| Date | Buyer | Sale Price | Title Company |
|---|---|---|---|
| $630,000 | -- | ||
| -- | -- | ||
| -- | -- | ||
| -- | -- | ||
| -- | -- |
We collect this data history from publicly available records. To have your information removed, we recommend requesting removal directly through your county’s website.
| Date | Status | Borrower | Loan Amount |
|---|---|---|---|
| Open | $504,000 | ||
| Previous Owner | $230,000 |
We collect this data history from publicly available records. To have your information removed, we recommend requesting removal directly through your county’s website.
| Date | Event | Price | List to Sale | Price per Sq Ft |
|---|---|---|---|---|
| 02/12/2026 02/12/26 | Sold | $630,000 | -1.6% | $282 / Sq Ft |
| 01/11/2026 01/11/26 | Pending | -- | -- | -- |
| 11/14/2025 11/14/25 | For Sale | $640,000 | -- | $286 / Sq Ft |
We collect this data history from publicly available records. To have your information removed, we recommend requesting removal directly through your county’s website.
| Year | Tax Paid | Tax Assessment Tax Assessment Total Assessment is a certain percentage of the fair market value that is determined by local assessors to be the total taxable value of land and additions on the property. | Land | Improvement |
|---|---|---|---|---|
| 2025 | $7,054 | $476,600 | $103,500 | $373,100 |
| 2024 | $7,006 | $476,600 | $103,500 | $373,100 |
| 2023 | $6,535 | $475,300 | $103,500 | $371,800 |
| 2022 | $5,977 | $465,100 | $103,500 | $361,600 |
| 2021 | $4,788 | $246,800 | $83,500 | $163,300 |
| 2020 | $4,450 | $234,200 | $83,500 | $150,700 |
| 2019 | $4,271 | $225,400 | $83,500 | $141,900 |
| 2018 | $3,868 | $212,500 | $83,500 | $129,000 |
| 2017 | $3,634 | $212,500 | $83,500 | $129,000 |
| 2016 | $3,616 | $212,700 | $83,700 | $129,000 |
| 2015 | $3,467 | $212,700 | $83,700 | $129,000 |
| 2014 | $3,149 | $181,000 | $76,500 | $104,500 |
| 2013 | $3,131 | $181,000 | $76,500 | $104,500 |
S
Seller's Agent in 2026
Susan Sinnett
RE/MAX
(207) 650-7863
1 in this area
12 Total Sales

Buyer's Agent in 2026
Jessie L'Heureux Herod
Keller Williams Realty
(207) 310-3368
4 in this area
174 Total Sales
A
Buyer Co-Listing Agent in 2026
Abigail Baker
Keller Williams Realty
(207) 350-5771
1 in this area
53 Total Sales
Source: Maine Listings
MLS Number: 1643530
APN: GRHM-000067-000006-000002
Disclaimer: Certain information contained herein is derived from information provided by parties other than Homes.com. All information provided is deemed reliable, but is not guaranteed to be accurate and should be independently verified.
![]() Listing data is derived in whole or in part from Maine Real Estate Information System, Inc. (d/b/a Maine Listings) and is for consumers' personal, noncommercial use only. Dimensions are approximate and not guaranteed. All data should be independently verified.
Listing data is derived in whole or in part from Maine Real Estate Information System, Inc. (d/b/a Maine Listings) and is for consumers' personal, noncommercial use only. Dimensions are approximate and not guaranteed. All data should be independently verified.
© 2026 Maine Real Estate Information System, Inc. All Rights Reserved. Equal Housing Opportunity.
Homes.com, LLC, 17600 Laguna Canyon Rd Irvine, CA 92618 (888)-952-6393
![]()
Ask me questions while you tour the home.