75 Richie Rd Attleboro, MA 02703
Estimated Value: $581,000 - $658,000
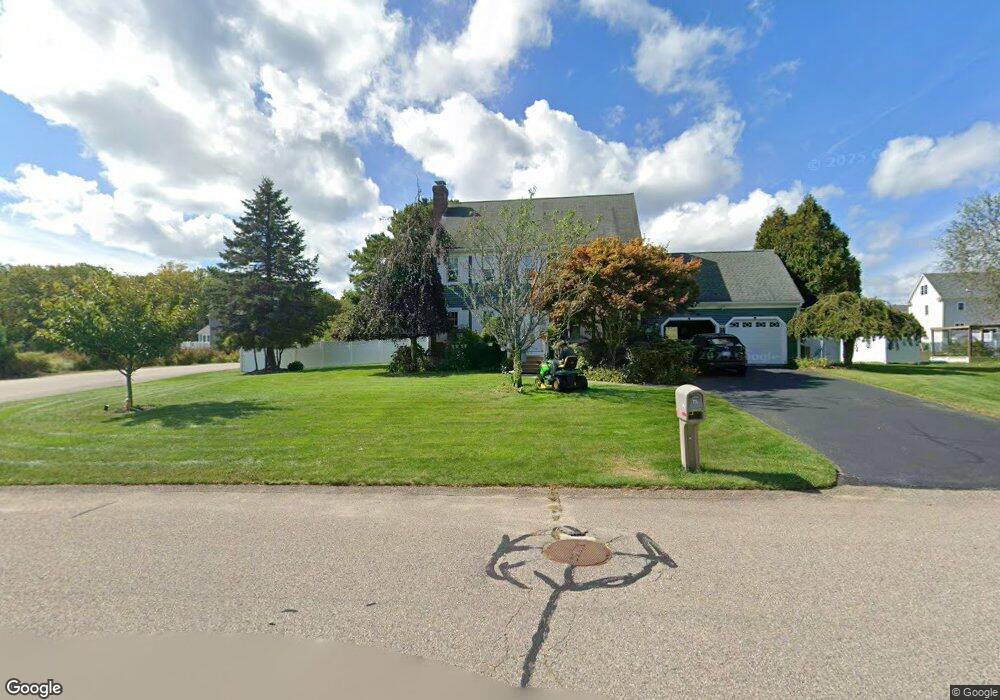
About This Home
This home is located at 75 Richie Rd, Attleboro, MA 02703 and is currently estimated at $623,665, approximately $276 per square foot. 75 Richie Rd is a home located in Bristol County with nearby schools including Peter Thacher Elementary School, Wamsutta Middle School, and Attleboro High School.
Ownership History
We collect this data history from publicly available records. To have your information removed, we recommend requesting removal directly through your county’s website.
Purchase Details
Home Financials for this Owner
Home Financials are based on the most recent Mortgage that was taken out on this home.Purchase Details
Home Values in the Area
Average Home Value in this Area
Purchase History
We collect this data history from publicly available records. To have your information removed, we recommend requesting removal directly through your county’s website.
| Date | Buyer | Sale Price | Title Company |
|---|---|---|---|
| $388,500 | -- | ||
| $157,855 | -- |
Mortgage History
We collect this data history from publicly available records. To have your information removed, we recommend requesting removal directly through your county’s website.
| Date | Status | Borrower | Loan Amount |
|---|---|---|---|
| Open | $290,000 | ||
| Closed | $281,697 | ||
| Closed | $310,800 | ||
| Previous Owner | $223,500 | ||
| Previous Owner | $205,000 |
Tax History
We collect this data history from publicly available records. To have your information removed, we recommend requesting removal directly through your county’s website.
| Year | Tax Paid | Tax Assessment Tax Assessment Total Assessment is a certain percentage of the fair market value that is determined by local assessors to be the total taxable value of land and additions on the property. | Land | Improvement |
|---|---|---|---|---|
| 2025 | $6,704 | $534,200 | $175,300 | $358,900 |
| 2024 | $6,326 | $496,900 | $157,900 | $339,000 |
| 2023 | $5,972 | $436,200 | $159,500 | $276,700 |
| 2022 | $5,728 | $396,400 | $152,100 | $244,300 |
| 2021 | $5,702 | $385,300 | $146,300 | $239,000 |
| 2020 | $5,431 | $373,000 | $139,700 | $233,300 |
| 2019 | $5,286 | $373,300 | $137,100 | $236,200 |
| 2018 | $5,122 | $345,600 | $133,100 | $212,500 |
| 2017 | $4,769 | $327,800 | $129,700 | $198,100 |
| 2016 | $4,612 | $311,200 | $121,200 | $190,000 |
| 2015 | $4,488 | $305,100 | $121,200 | $183,900 |
| 2014 | $4,421 | $297,700 | $115,900 | $181,800 |
Map
- 23 York Dr
- 18 York Dr
- 640 Oakhill Ave
- 323 Oakhill Ave
- 59 Marlise Dr
- 2 Valley Run Dr
- 12 Valley Run Dr
- 1003 Oakhill Ave Unit 3
- 36 Catherine Dr
- 545 Tremont St
- 149 Thurber Ave
- 10 Dailey St Unit H
- 18 Dailey St Unit H
- 429 S Main St
- 429 S Main St Unit 11
- 20 Mine Brook Rd
- 52 Carpenter St
- 13 Oakdale St
- 67 Handy St
- 14 Wilmarth St
- 19 Nicholas Dr
- 15 Nicholas Dr
- 23 Nicholas Dr
- 23 Nicholas Dr
- 67 Richie Rd
- 18 Nicholas Dr
- 18 Nicholas Dr
- 18 Nicholas Dr
- 22 Nicholas Dr
- 27 Nicholas Dr
- 27 Nicholas Dr
- 27 Nicholas Dr
- 14 Nicholas Dr
- 59 Richie Rd
- 26 Nicholas Dr
- 26 Nicholas Dr
- 26 Nicholas Dr
- 26 Nicholas Dr
- 11 Nicholas Dr
- 0 Lot 19 Saveena Dr Unit 72589277
Ask me questions while you tour the home.