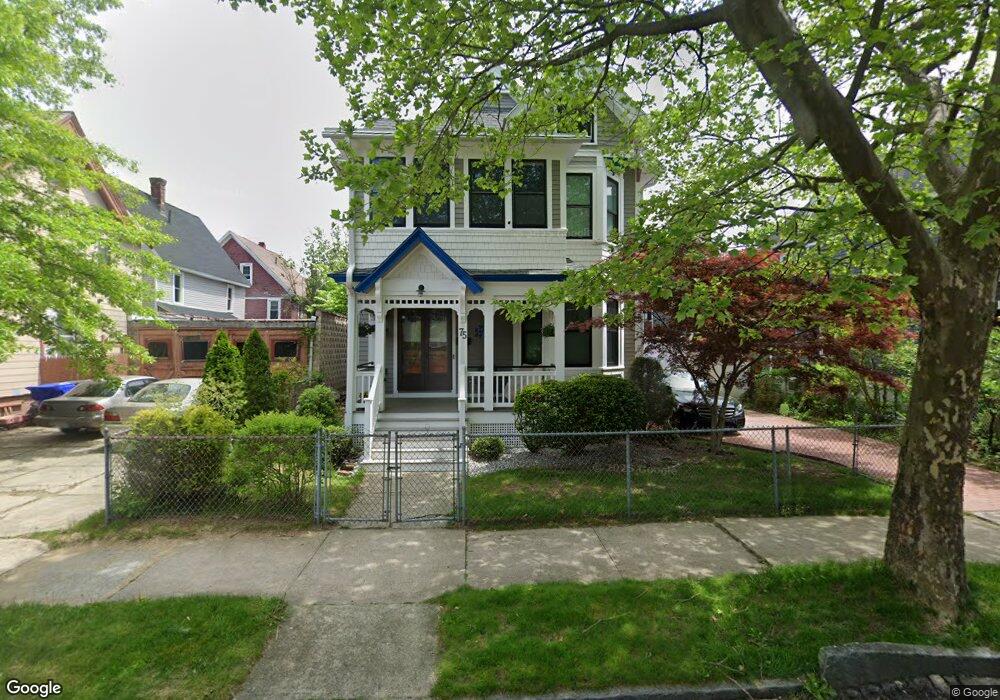
75 Yale St Springfield, MA 01109
McKnight NeighborhoodEstimated Value: $272,899 - $301,000
4
Beds
2
Baths
2,386
Sq Ft
$120/Sq Ft
Est. Value
About This Home
This home is located at 75 Yale St, Springfield, MA 01109 and is currently estimated at $285,975, approximately $119 per square foot. 75 Yale St is a home located in Hampden County with nearby schools including Van Sickle Academy, High School Of Commerce, and Roger L. Putnam Vocational Technical Academy.
Ownership History
Date
Name
Owned For
Owner Type
Purchase Details
Closed on
Oct 6, 1989
Sold by
Watson Earl
Bought by
Gowan Anthony
Current Estimated Value
Home Financials for this Owner
Home Financials are based on the most recent Mortgage that was taken out on this home.
Original Mortgage
$79,800
Interest Rate
10.12%
Mortgage Type
Purchase Money Mortgage
Create a Home Valuation Report for This Property
The Home Valuation Report is an in-depth analysis detailing your home's value as well as a comparison with similar homes in the area
Home Values in the Area
Average Home Value in this Area
Purchase History
| Date | Buyer | Sale Price | Title Company |
|---|---|---|---|
| Gowan Anthony | $84,000 | -- |
Source: Public Records
Mortgage History
| Date | Status | Borrower | Loan Amount |
|---|---|---|---|
| Open | Gowan Anthony | $73,000 | |
| Closed | Gowan Anthony | $79,800 | |
| Previous Owner | Gowan Anthony | $61,000 |
Source: Public Records
Tax History
| Year | Tax Paid | Tax Assessment Tax Assessment Total Assessment is a certain percentage of the fair market value that is determined by local assessors to be the total taxable value of land and additions on the property. | Land | Improvement |
|---|---|---|---|---|
| 2025 | $3,581 | $228,400 | $24,600 | $203,800 |
| 2024 | $3,533 | $220,000 | $23,000 | $197,000 |
| 2023 | $3,372 | $197,800 | $21,900 | $175,900 |
| 2022 | $2,443 | $129,800 | $19,900 | $109,900 |
| 2021 | $2,332 | $123,400 | $18,100 | $105,300 |
| 2020 | $2,203 | $112,800 | $18,100 | $94,700 |
| 2019 | $2,092 | $106,300 | $15,400 | $90,900 |
| 2018 | $2,222 | $112,900 | $15,400 | $97,500 |
| 2017 | $2,231 | $113,500 | $14,500 | $99,000 |
| 2016 | $2,204 | $112,100 | $14,500 | $97,600 |
| 2015 | $2,213 | $112,500 | $14,500 | $98,000 |
Source: Public Records
Map
Nearby Homes
- 158 Bowles St
- 186 Buckingham St
- 485 Bay St
- 158-160 Oak Grove Ave
- 44-46 Edgewood St
- 49 Andrew St
- 34 Savoy Ave Unit 36
- 1030 Worthington St
- 35 Merrimac Ave
- 174 Bowdoin St
- 32-34 Van Buren Ave
- 105 Wilber St
- 138 Wilber St
- 540-542 Union St
- 118 Quincy St
- 536-538 Union St
- 140 Eddy St
- 108-110 Northampton Ave
- 115-117 Northampton Ave
- 14-16 Wolcott St
Your Personal Tour Guide
Ask me questions while you tour the home.