750 Karry Way Fallon, NV 89406
Estimated Value: $374,699 - $390,000
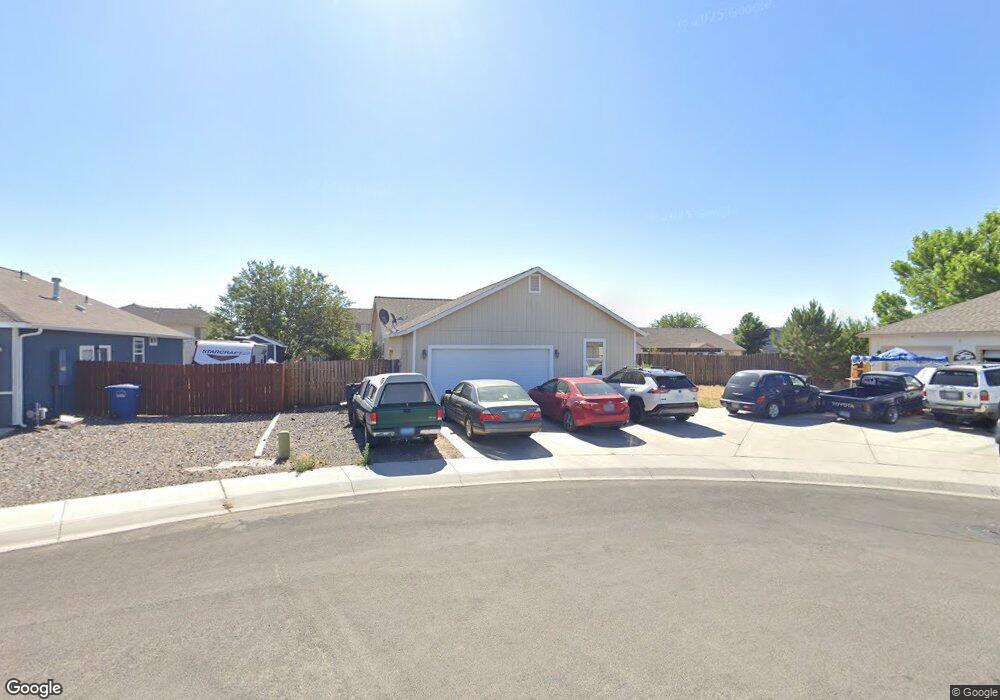
About This Home
This home is located at 750 Karry Way, Fallon, NV 89406 and is currently estimated at $382,425, approximately $279 per square foot. 750 Karry Way is a home located in Churchill County with nearby schools including Lahontan Elementary School, E.C. Best Elementary School, and Numa Elementary School.
Ownership History
We collect this data history from publicly available records. To have your information removed, we recommend requesting removal directly through your county’s website.
Purchase Details
Purchase Details
Purchase Details
Home Values in the Area
Average Home Value in this Area
Purchase History
We collect this data history from publicly available records. To have your information removed, we recommend requesting removal directly through your county’s website.
| Date | Buyer | Sale Price | Title Company |
|---|---|---|---|
| $124,000 | Western Nevada Title Company | ||
| $449,729 | Stewart Title Company | ||
| -- | Stewart Title Company | ||
| -- | Stewart Title Company |
Tax History
We collect this data history from publicly available records. To have your information removed, we recommend requesting removal directly through your county’s website.
| Year | Tax Paid | Tax Assessment Tax Assessment Total Assessment is a certain percentage of the fair market value that is determined by local assessors to be the total taxable value of land and additions on the property. | Land | Improvement |
|---|---|---|---|---|
| 2025 | $2,364 | $90,372 | $21,700 | $68,672 |
| 2024 | $2,364 | $89,073 | $19,950 | $69,123 |
| 2023 | $2,364 | $84,570 | $19,950 | $64,620 |
| 2022 | $2,224 | $67,719 | $11,900 | $55,819 |
| 2021 | $2,057 | $65,907 | $11,900 | $54,007 |
| 2020 | $1,981 | $61,935 | $11,900 | $50,035 |
| 2019 | $1,913 | $60,618 | $11,900 | $48,718 |
| 2018 | $1,826 | $59,309 | $11,900 | $47,409 |
| 2017 | $1,752 | $57,859 | $10,500 | $47,359 |
| 2016 | $1,708 | $50,640 | $7,875 | $42,765 |
| 2015 | $1,670 | $45,747 | $7,875 | $37,872 |
| 2014 | $1,625 | $42,293 | $7,875 | $34,418 |
Map
- 804 Maple Way
- 836 Maple Way
- 540 Michael Dr
- 765 Hunter Park Way
- 461 Pintail Dr
- 894 Timothy Way
- 430 Pintail Dr
- 829 Great Basin Ln
- 1085 Tamarack Ct
- 441 Venturacci Ln
- 815 Great Basin Ln
- 1135 Tamarack Dr
- 606 Sycamore Dr
- 455 Sunrise Terrace
- 1100 Venturacci Ln
- 630 Keppel St
- 618 Keppel St
- 1221 Golden Park Way
- 1400 Golden Park Way
- 1417 Ken Ln
Ask me questions while you tour the home.