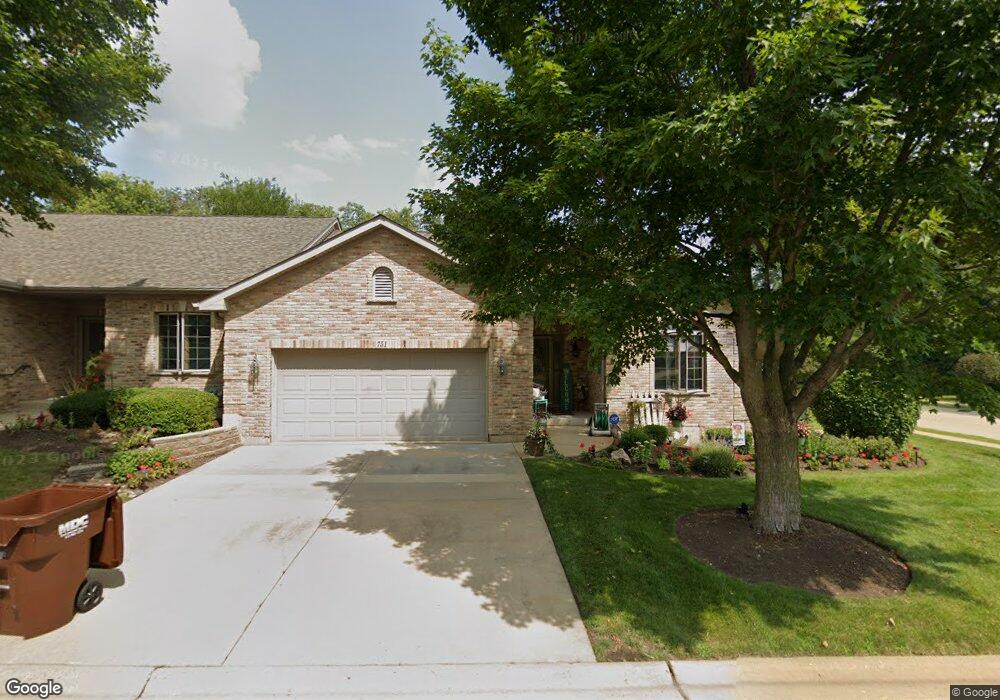
751 Bauman St Unit 4 Marengo, IL 60152
Estimated Value: $303,841 - $318,000
2
Beds
--
Bath
1,839
Sq Ft
$169/Sq Ft
Est. Value
About This Home
This home is located at 751 Bauman St Unit 4, Marengo, IL 60152 and is currently estimated at $311,210, approximately $169 per square foot. 751 Bauman St Unit 4 is a home located in McHenry County with nearby schools including Riley Community Consolidated School District 18, Marengo Community High School, and Zion Lutheran School.
Ownership History
Date
Name
Owned For
Owner Type
Purchase Details
Closed on
Apr 27, 2017
Sold by
Garbarski Doanld R and Garbarski Lorraine Bandel
Bought by
Rakow Robert and Rakow Penny
Current Estimated Value
Home Financials for this Owner
Home Financials are based on the most recent Mortgage that was taken out on this home.
Original Mortgage
$159,920
Outstanding Balance
$133,966
Interest Rate
4.37%
Mortgage Type
New Conventional
Estimated Equity
$177,244
Purchase Details
Closed on
Jun 15, 2015
Sold by
Garbarski Donald R and Garbarski Lorraine Bandel
Bought by
The Garbarski Family Trust and Garbarski Lorraine Bandel
Purchase Details
Closed on
May 22, 2015
Sold by
Lindberg William J and Lindberg Charles A
Bought by
Garbarski Donald R and Garbarski Lorraine
Purchase Details
Closed on
Mar 27, 2002
Sold by
Brackmann Construction Company
Bought by
Lindberg Charles A and Lindberg Joanna L
Create a Home Valuation Report for This Property
The Home Valuation Report is an in-depth analysis detailing your home's value as well as a comparison with similar homes in the area
Home Values in the Area
Average Home Value in this Area
Purchase History
We collect this data history from publicly available records. To have your information removed, we recommend requesting removal directly through your county’s website.
| Date | Buyer | Sale Price | Title Company |
|---|---|---|---|
| Rakow Robert | $199,900 | Attorneys Title Guaranty Fun | |
| The Garbarski Family Trust | -- | Attorney | |
| Garbarski Donald R | $161,000 | Nlt Title Llc | |
| Lindberg Charles A | $190,000 | Chicago Title |
Source: Public Records
Mortgage History
We collect this data history from publicly available records. To have your information removed, we recommend requesting removal directly through your county’s website.
| Date | Status | Borrower | Loan Amount |
|---|---|---|---|
| Open | Rakow Robert | $159,920 |
Source: Public Records
Tax History
| Year | Tax Paid | Tax Assessment Tax Assessment Total Assessment is a certain percentage of the fair market value that is determined by local assessors to be the total taxable value of land and additions on the property. | Land | Improvement |
|---|---|---|---|---|
| 2024 | $4,908 | $90,509 | $6,610 | $83,899 |
| 2023 | $5,718 | $80,653 | $5,890 | $74,763 |
| 2022 | $5,988 | $73,953 | $5,401 | $68,552 |
| 2021 | $4,786 | $68,519 | $5,004 | $63,515 |
| 2020 | $5,979 | $64,775 | $4,731 | $60,044 |
| 2019 | $6,337 | $61,997 | $4,528 | $57,469 |
| 2018 | $5,779 | $57,664 | $3,483 | $54,181 |
| 2017 | $6,366 | $55,741 | $3,367 | $52,374 |
| 2016 | $6,312 | $53,618 | $3,239 | $50,379 |
| 2013 | -- | $47,760 | $8,166 | $39,594 |
Source: Public Records
Map
Nearby Homes
- 870 Mildred Dr
- 640 Cloverleaf Dr
- 816 Doral Dr
- 821 Diane Ct
- 919 Spring Dr
- 0 Maple St
- 737 E Grant Hwy
- 214 S Prospect St
- 351 Elm St
- 0 Ratfield Rd
- 5 Lindow Ave
- 8 Lindow Ave
- 6 Lindow Ave
- 895 Stanford Dr
- 204 E Washington St
- 704 Echo (Lot 21) Trail
- 806 Echo (Lot 22) Trail
- 0 Church Rd SE Unit MRD12644769
- 802 Echo (Lot 23) Trail
- 439 W Grant Hwy
- 749 Bauman St Unit 3
- 747 Bauman St Unit 2
- 745 Bauman St Unit 1
- 725 Bauman St
- 755 Bauman St Unit 5
- 761 Bauman St
- 715 Bauman St
- 790 Bauman St Unit 12
- 770 Bauman St Unit 10
- 760 Bauman St Unit 9
- 780 Bauman St Unit 11
- 705 Bauman St
- 740 Meadow Ln Unit 14
- 750 Meadow Ln Unit 15
- 730 Meadow Ln Unit 13
- 760 Meadow Ln Unit 16
- 750 Bauman St
- 740 Bauman St
- 730 Bauman St
- 730 Riley Dr
Your Personal Tour Guide
Ask me questions while you tour the home.