751 Main St E Monmouth, OR 97361
Estimated Value: $354,946 - $402,000
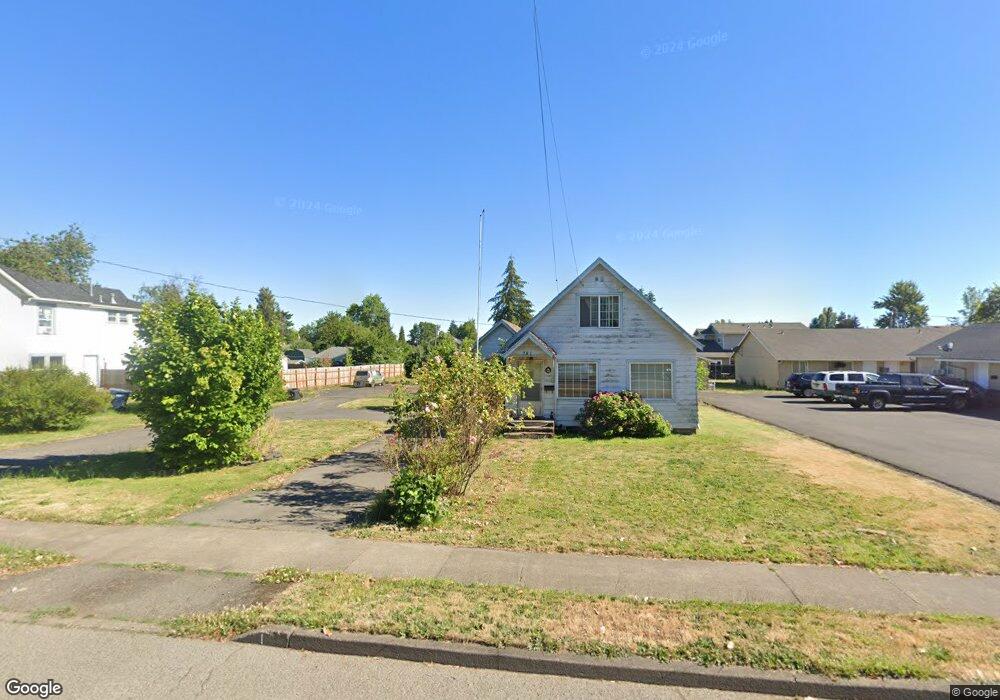
About This Home
This home is located at 751 Main St E, Monmouth, OR 97361 and is currently estimated at $382,487, approximately $336 per square foot. 751 Main St E is a home located in Polk County with nearby schools including Monmouth Elementary School, Talmadge Middle School, and Central High School.
Ownership History
We collect this data history from publicly available records. To have your information removed, we recommend requesting removal directly through your county’s website.
Purchase Details
Home Financials for this Owner
Home Financials are based on the most recent Mortgage that was taken out on this home.Home Values in the Area
Average Home Value in this Area
Purchase History
We collect this data history from publicly available records. To have your information removed, we recommend requesting removal directly through your county’s website.
| Date | Buyer | Sale Price | Title Company |
|---|---|---|---|
| $132,000 | Ticor Title |
Mortgage History
We collect this data history from publicly available records. To have your information removed, we recommend requesting removal directly through your county’s website.
| Date | Status | Borrower | Loan Amount |
|---|---|---|---|
| Open | $105,600 | ||
| Closed | $13,200 |
Tax History
We collect this data history from publicly available records. To have your information removed, we recommend requesting removal directly through your county’s website.
| Year | Tax Paid | Tax Assessment Tax Assessment Total Assessment is a certain percentage of the fair market value that is determined by local assessors to be the total taxable value of land and additions on the property. | Land | Improvement |
|---|---|---|---|---|
| 2026 | $2,902 | $174,560 | $71,170 | $103,390 |
| 2025 | $2,794 | $169,480 | $69,090 | $100,390 |
| 2024 | $2,794 | $164,550 | $67,080 | $97,470 |
| 2023 | $2,911 | $159,760 | $65,120 | $94,640 |
| 2022 | $2,619 | $155,110 | $63,220 | $91,890 |
| 2021 | $2,590 | $150,600 | $61,370 | $89,230 |
| 2020 | $2,487 | $146,220 | $59,580 | $86,640 |
| 2019 | $2,415 | $141,970 | $57,840 | $84,130 |
| 2018 | $2,332 | $137,840 | $56,160 | $81,680 |
| 2017 | $2,319 | $133,830 | $54,520 | $79,310 |
| 2016 | $2,365 | $129,940 | $52,940 | $77,000 |
| 2015 | $2,265 | $126,160 | $51,400 | $74,760 |
| 2014 | $2,196 | $122,490 | $49,900 | $72,590 |
Map
- 790 Clay St E
- 952 Main St E
- 736 Dalke St E
- 784 Dalke St E
- 297 Heffley St S
- 103 Atwater St S
- 145 Ecols St N
- 371 Ecols St S
- 162 Ecols St N
- 738 E Fen Way
- 271 Clay St E
- 1329 Price Ln E
- 505 Broad St S
- 1370 Bentley St E
- 555 Sacre Ln N
- 427 Warren St S
- 1115 Gwinn St E
- 545 Warren St S
- 545 Warren St S Unit 12
- 615 Sacre Ln N
- 760 Clay St E
- 780 Clay St E
- 740 Clay St E
- 730 Clay St E
- 166 Craven St S
- 134 Craven St S
- 797 Main (A&b)
- 767 Clay (769 & 771) St E
- 745 Clay St E
- 767 Clay St E
- 112 Craven St S
- 819 Main St E
- 230 Craven St S
- 110 Craven (-112) St S
- 715 Clay St E
- 120 Craven St N
- 120 & 122 Craven St
- 753 Clay St E Unit 14
- 753 Clay St E Unit 1
- 110 Craven St N
Ask me questions while you tour the home.