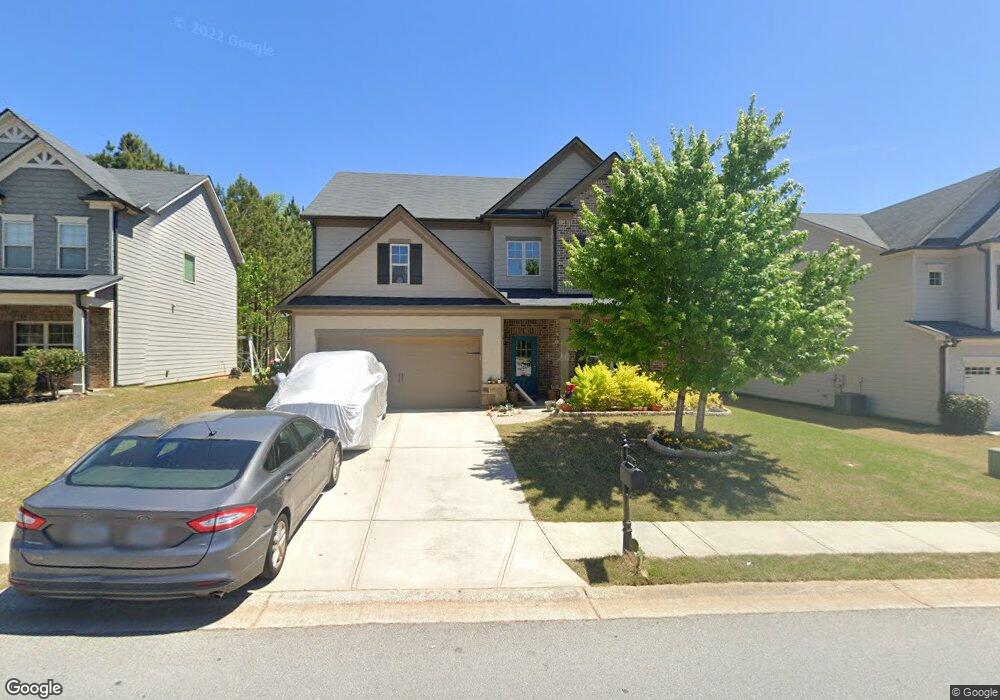
7520 Silk Tree Pointe Braselton, GA 30517
Estimated Value: $423,463 - $453,000
About This Home
This home is located at 7520 Silk Tree Pointe, Braselton, GA 30517 and is currently estimated at $439,616, approximately $164 per square foot. 7520 Silk Tree Pointe is a home with nearby schools including West Jackson Elementary School, West Jackson Middle School, and Jackson County High School.
Ownership History
We collect this data history from publicly available records. To have your information removed, we recommend requesting removal directly through your county’s website.
Purchase Details
Home Financials for this Owner
Home Financials are based on the most recent Mortgage that was taken out on this home.Purchase Details
Purchase Details
Purchase Details
Purchase Details
Purchase Details
Purchase Details
Home Values in the Area
Average Home Value in this Area
Purchase History
We collect this data history from publicly available records. To have your information removed, we recommend requesting removal directly through your county’s website.
| Date | Buyer | Sale Price | Title Company |
|---|---|---|---|
| $237,132 | -- | ||
| -- | -- | ||
| $660,000 | -- | ||
| -- | -- | ||
| $4,400 | -- | ||
| -- | -- | ||
| $1,804 | -- |
Mortgage History
We collect this data history from publicly available records. To have your information removed, we recommend requesting removal directly through your county’s website.
| Date | Status | Borrower | Loan Amount |
|---|---|---|---|
| Open | $225,275 |
Tax History
We collect this data history from publicly available records. To have your information removed, we recommend requesting removal directly through your county’s website.
| Year | Tax Paid | Tax Assessment Tax Assessment Total Assessment is a certain percentage of the fair market value that is determined by local assessors to be the total taxable value of land and additions on the property. | Land | Improvement |
|---|---|---|---|---|
| 2025 | $4,814 | $173,360 | $24,800 | $148,560 |
| 2024 | $4,814 | $173,360 | $24,800 | $148,560 |
| 2023 | $4,860 | $155,160 | $24,800 | $130,360 |
| 2022 | $4,054 | $128,360 | $24,800 | $103,560 |
| 2021 | $3,910 | $122,760 | $19,200 | $103,560 |
| 2020 | $3,794 | $109,720 | $19,200 | $90,520 |
| 2019 | $3,727 | $105,960 | $15,440 | $90,520 |
| 2018 | $3,602 | $101,560 | $15,440 | $86,120 |
| 2017 | $3,224 | $90,450 | $15,440 | $75,010 |
| 2016 | $564 | $15,440 | $15,440 | $0 |
| 2015 | $367 | $10,000 | $10,000 | $0 |
| 2014 | $288 | $10,000 | $10,000 | $0 |
| 2013 | -- | $1,920 | $1,920 | $0 |
Map
- 9518 Rushmore Cir
- 3244 Hawthorne Path
- 7660 Silk Tree Pointe
- 9547 Rushmore Cir
- 7671 Silk Tree Pointe
- 7671 Silk Tree
- 9864 Elderberry Pointe
- 7811 Silk Tree Pointe
- 6643 Silk Tree Pointe
- 7120 Silk Tree Pointe
- 1547 Liberty Park Dr
- 6503 Silk Tree Pointe
- 6503 Silk Tree
- 799 Gold Crest Dr
- 799 Gold Crest Rd
- 207 Nugget Trail
- 6943 Grand Hickory Dr
- 60 Linden Ct
- 2810 Beech Trail
- 6825 White Walnut Way
- 7530 Silk Tree Pte
- 7511 Silk Tree Pte
- 7511 Silk Tree
- 7530 Silk Tree Pointe
- 7510 Silk Tree Pointe
- 7510 Silk Tree Pointe
- 7530 Silk Tree
- 7540 Silk Tree Pte
- 7540 Silk Tree Pointe
- 7510 Silk Tree Pte
- 7531 Silk Tree Pte
- 7531 Silk Tree Pointe
- 7490 Silk Tree
- 7531 Silk Tree Pointe
- 7550 Silk Tree Pointe
- 7550 Silk Tree Pte
- 7541 Silk Tree Pte
- 7511 Silk Tree Pointe
- 7541 Silk Tree Pointe
- 7500 Silk Tree Pointe
Ask me questions while you tour the home.