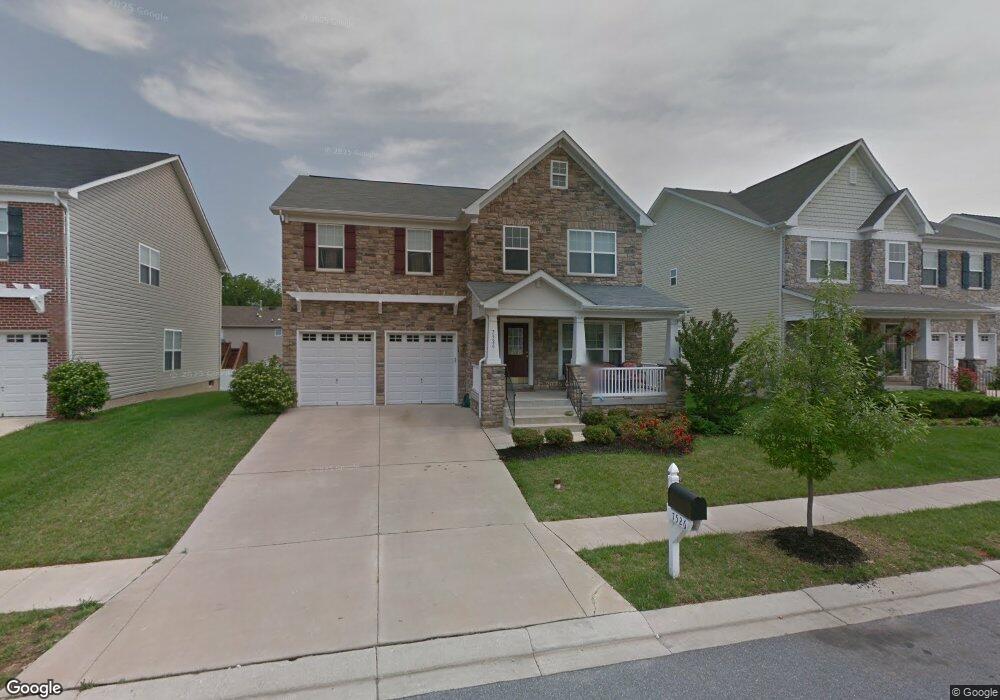
7526 Roxy Dr Windsor Mill, MD 21244
Estimated Value: $542,787 - $680,000
Studio
4
Baths
3,280
Sq Ft
$186/Sq Ft
Est. Value
About This Home
This home is located at 7526 Roxy Dr, Windsor Mill, MD 21244 and is currently estimated at $608,447, approximately $185 per square foot. 7526 Roxy Dr is a home located in Baltimore County with nearby schools including Winfield Elementary School, Windsor Mill Middle School, and Milford Mill Academy.
Ownership History
Date
Name
Owned For
Owner Type
Purchase Details
Closed on
May 3, 2011
Sold by
Samaila Daniel
Bought by
Mbahi Hyeladzira G
Current Estimated Value
Purchase Details
Closed on
Apr 21, 2011
Sold by
Samaila Daniel
Bought by
Mbahi Hyeladzira G
Purchase Details
Closed on
Jun 14, 2007
Sold by
K Hovnanian Homes Of
Bought by
Samaila Daniel and Mbahi Hyeladzira G
Home Financials for this Owner
Home Financials are based on the most recent Mortgage that was taken out on this home.
Original Mortgage
$74,500
Interest Rate
6.47%
Mortgage Type
Stand Alone Second
Purchase Details
Closed on
Oct 17, 2006
Sold by
K Hovnanian Homes Of
Bought by
Samaila Daniel and Mbahi Hyeladzira G
Home Financials for this Owner
Home Financials are based on the most recent Mortgage that was taken out on this home.
Original Mortgage
$397,800
Interest Rate
6.47%
Mortgage Type
Purchase Money Mortgage
Create a Home Valuation Report for This Property
The Home Valuation Report is an in-depth analysis detailing your home's value as well as a comparison with similar homes in the area
Home Values in the Area
Average Home Value in this Area
Purchase History
| Date | Buyer | Sale Price | Title Company |
|---|---|---|---|
| Mbahi Hyeladzira G | -- | -- | |
| Mbahi Hyeladzira G | -- | -- | |
| Samaila Daniel | $497,293 | -- | |
| Samaila Daniel | $497,293 | -- |
Source: Public Records
Mortgage History
| Date | Status | Borrower | Loan Amount |
|---|---|---|---|
| Previous Owner | Samaila Daniel | $74,500 | |
| Previous Owner | Samaila Daniel | $397,800 | |
| Previous Owner | Samaila Daniel | $397,800 |
Source: Public Records
Tax History
| Year | Tax Paid | Tax Assessment Tax Assessment Total Assessment is a certain percentage of the fair market value that is determined by local assessors to be the total taxable value of land and additions on the property. | Land | Improvement |
|---|---|---|---|---|
| 2025 | $7,296 | $507,233 | -- | -- |
| 2024 | $7,296 | $465,700 | $83,800 | $381,900 |
| 2023 | $3,656 | $459,400 | $0 | $0 |
| 2022 | $7,022 | $453,100 | $0 | $0 |
| 2021 | $6,267 | $446,800 | $83,800 | $363,000 |
| 2020 | $6,267 | $424,733 | $0 | $0 |
| 2019 | $6,559 | $402,667 | $0 | $0 |
| 2018 | $5,508 | $380,600 | $83,800 | $296,800 |
| 2017 | $5,468 | $366,867 | $0 | $0 |
| 2016 | $5,253 | $353,133 | $0 | $0 |
| 2015 | $5,253 | $339,400 | $0 | $0 |
| 2014 | $5,253 | $339,400 | $0 | $0 |
Source: Public Records
Map
Nearby Homes
- 3405 Joann Dr
- 7824 Big Buck Dr
- 3508 Joann Dr
- 3412 Mayfield Ave
- 8011 Remington Ave
- 8314 Tinsley Rd
- 3521 Joann Dr
- 7410 Castlemoor Rd
- 3528 Millvale Rd
- 3126 Rices Ln
- 3405 Washington Ave
- 1 Chris Ct
- 2915 N Rolling Rd
- 3413 Barkley Woods Rd
- 8206 Kirk Farm Cir
- 2721 Claybrooke Dr
- 3439 Barkley Woods Rd
- 8400 Liberty Rd
- 2801 Ashfield Dr Unit 103
- 3429 Edcrest Rd
Your Personal Tour Guide
Ask me questions while you tour the home.