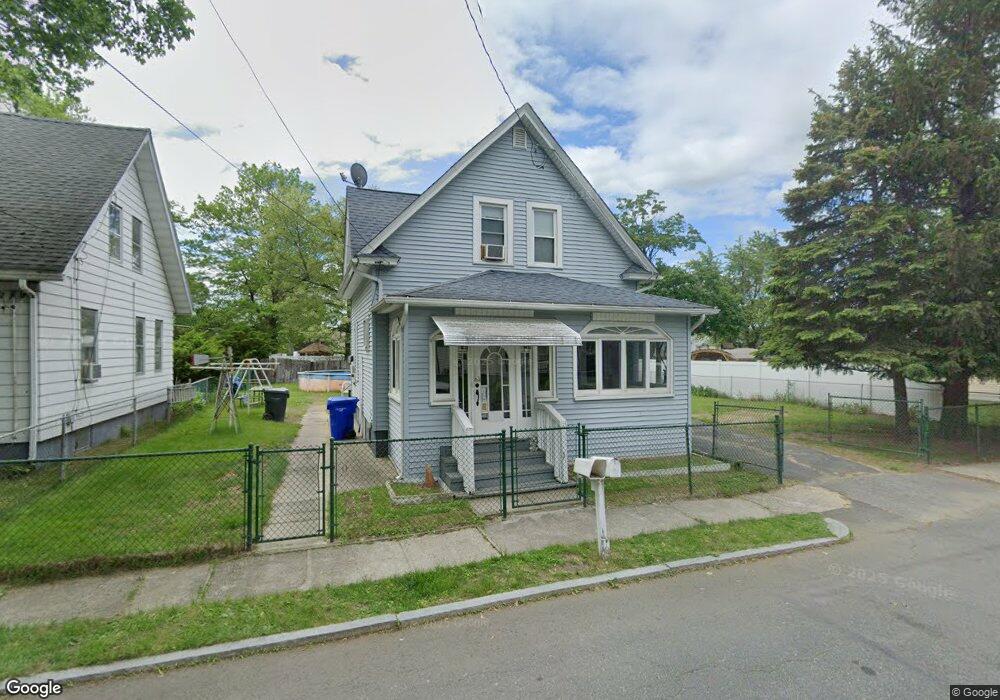
76 Gresham St Springfield, MA 01119
Pine Point NeighborhoodEstimated Value: $245,000 - $289,000
2
Beds
2
Baths
979
Sq Ft
$267/Sq Ft
Est. Value
About This Home
This home is located at 76 Gresham St, Springfield, MA 01119 and is currently estimated at $261,539, approximately $267 per square foot. 76 Gresham St is a home located in Hampden County with nearby schools including Thomas M Balliet Elementary School, John J Duggan Middle, and Springfield Central High School.
Ownership History
Date
Name
Owned For
Owner Type
Purchase Details
Closed on
Oct 3, 2025
Sold by
Boyer Nancy L Est and Boyer
Bought by
Boyer Alan L
Current Estimated Value
Purchase Details
Closed on
Sep 29, 1987
Sold by
Bosch Luis
Bought by
Boyer Alan L
Home Financials for this Owner
Home Financials are based on the most recent Mortgage that was taken out on this home.
Original Mortgage
$50,000
Interest Rate
10.37%
Mortgage Type
Purchase Money Mortgage
Create a Home Valuation Report for This Property
The Home Valuation Report is an in-depth analysis detailing your home's value as well as a comparison with similar homes in the area
Home Values in the Area
Average Home Value in this Area
Purchase History
| Date | Buyer | Sale Price | Title Company |
|---|---|---|---|
| Boyer Alan L | -- | -- | |
| Boyer Alan L | $78,500 | -- |
Source: Public Records
Mortgage History
| Date | Status | Borrower | Loan Amount |
|---|---|---|---|
| Previous Owner | Boyer Alan L | $50,000 |
Source: Public Records
Tax History
| Year | Tax Paid | Tax Assessment Tax Assessment Total Assessment is a certain percentage of the fair market value that is determined by local assessors to be the total taxable value of land and additions on the property. | Land | Improvement |
|---|---|---|---|---|
| 2025 | $3,062 | $195,300 | $40,800 | $154,500 |
| 2024 | $2,897 | $180,400 | $34,000 | $146,400 |
| 2023 | $2,892 | $169,600 | $30,900 | $138,700 |
| 2022 | $2,518 | $133,800 | $28,900 | $104,900 |
| 2021 | $2,548 | $134,800 | $26,300 | $108,500 |
| 2020 | $2,625 | $134,400 | $26,300 | $108,100 |
| 2019 | $2,338 | $118,800 | $26,300 | $92,500 |
| 2018 | $2,157 | $109,600 | $26,300 | $83,300 |
| 2017 | $2,119 | $107,800 | $24,300 | $83,500 |
| 2016 | $1,988 | $101,100 | $24,300 | $76,800 |
| 2015 | $1,967 | $100,000 | $24,300 | $75,700 |
Source: Public Records
Map
Nearby Homes
Your Personal Tour Guide
Ask me questions while you tour the home.