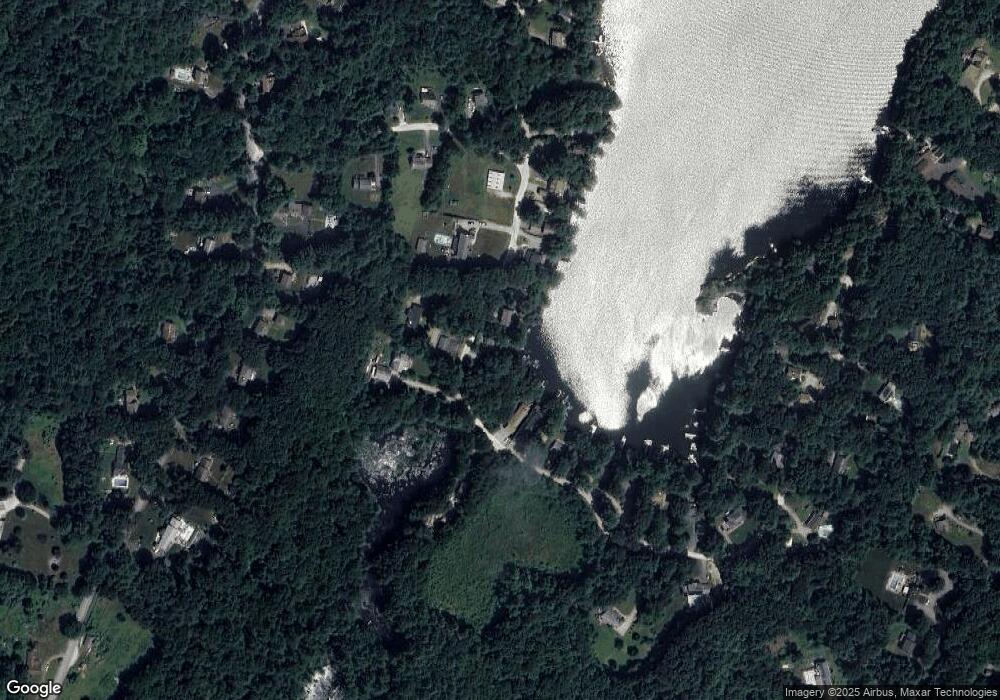
76 S Shore Dr Sturbridge, MA 01566
Estimated Value: $575,000 - $925,000
2
Beds
2
Baths
1,060
Sq Ft
$626/Sq Ft
Est. Value
About This Home
This home is located at 76 S Shore Dr, Sturbridge, MA 01566 and is currently estimated at $663,570, approximately $626 per square foot. 76 S Shore Dr is a home located in Worcester County with nearby schools including Burgess Elementary School, Tantasqua Regional Junior High School, and Tantasqua Regional High School.
Ownership History
Date
Name
Owned For
Owner Type
Purchase Details
Closed on
Nov 30, 2022
Sold by
Mimeault Peter J and Mimeault Rebecca G
Bought by
Mimeault Irt
Current Estimated Value
Purchase Details
Closed on
Apr 18, 2008
Sold by
Neal Edmond A
Bought by
Mimeault Peter J and Mimeault Rebecca Gould
Purchase Details
Closed on
Feb 25, 2004
Sold by
Johnson Michael J
Bought by
Mimeault Peter J and Mimeault Rebecca Gould
Purchase Details
Closed on
Jun 18, 1999
Sold by
Jacques Thomas E and Jacques Marie A
Bought by
Johnson Michael J
Home Financials for this Owner
Home Financials are based on the most recent Mortgage that was taken out on this home.
Original Mortgage
$135,000
Interest Rate
6.99%
Mortgage Type
Purchase Money Mortgage
Create a Home Valuation Report for This Property
The Home Valuation Report is an in-depth analysis detailing your home's value as well as a comparison with similar homes in the area
Home Values in the Area
Average Home Value in this Area
Purchase History
| Date | Buyer | Sale Price | Title Company |
|---|---|---|---|
| Mimeault Irt | -- | None Available | |
| Mimeault Peter J | -- | -- | |
| Neal Edmond A | -- | -- | |
| Mimeault Peter J | $235,000 | -- | |
| Johnson Michael J | $140,000 | -- |
Source: Public Records
Mortgage History
| Date | Status | Borrower | Loan Amount |
|---|---|---|---|
| Previous Owner | Johnson Michael J | $35,000 | |
| Previous Owner | Johnson Michael J | $45,000 | |
| Previous Owner | Johnson Michael J | $135,000 |
Source: Public Records
Tax History
| Year | Tax Paid | Tax Assessment Tax Assessment Total Assessment is a certain percentage of the fair market value that is determined by local assessors to be the total taxable value of land and additions on the property. | Land | Improvement |
|---|---|---|---|---|
| 2025 | $9,963 | $625,400 | $390,000 | $235,400 |
| 2024 | $8,395 | $509,100 | $306,400 | $202,700 |
| 2023 | $8,050 | $445,500 | $268,300 | $177,200 |
| 2022 | $7,763 | $405,400 | $242,500 | $162,900 |
| 2021 | $7,226 | $379,900 | $231,300 | $148,600 |
| 2020 | $7,226 | $379,900 | $231,300 | $148,600 |
| 2019 | $7,231 | $377,600 | $238,500 | $139,100 |
| 2018 | $6,998 | $360,000 | $227,300 | $132,700 |
| 2017 | $6,276 | $323,500 | $218,600 | $104,900 |
| 2016 | $6,186 | $322,000 | $212,000 | $110,000 |
| 2015 | $6,132 | $318,700 | $212,000 | $106,700 |
Source: Public Records
Map
Nearby Homes
Your Personal Tour Guide
Ask me questions while you tour the home.