76 Spruce St Rockland, MA 02370
Estimated Value: $560,955 - $635,000
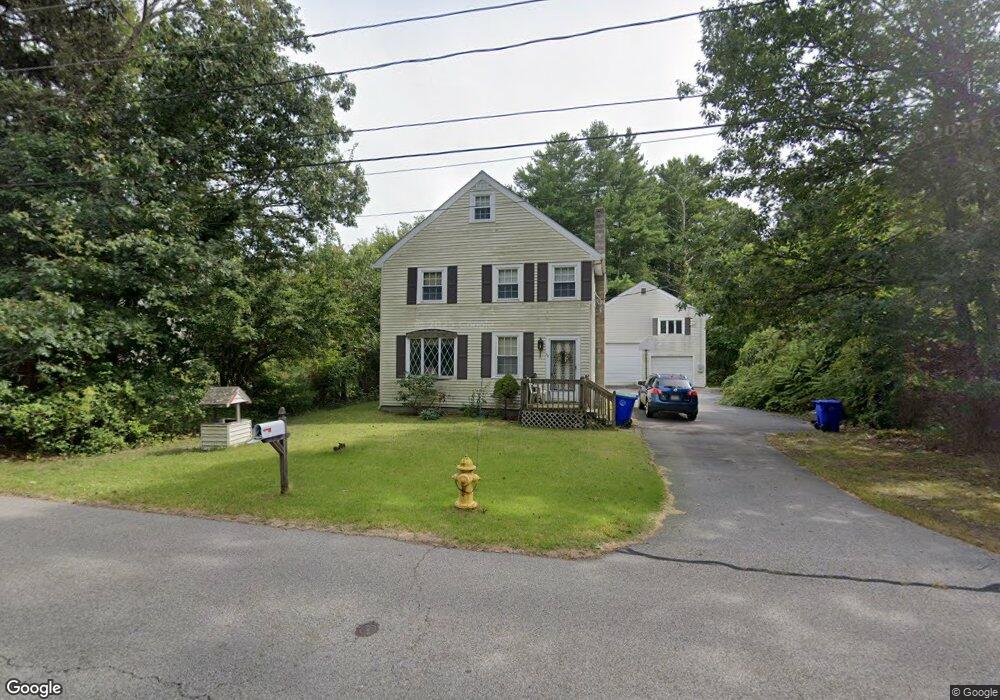
About This Home
This home is located at 76 Spruce St, Rockland, MA 02370 and is currently estimated at $591,989, approximately $293 per square foot. 76 Spruce St is a home located in Plymouth County with nearby schools including Rockland Senior High School, Calvary Chapel Academy, and St Bridget School.
Ownership History
We collect this data history from publicly available records. To have your information removed, we recommend requesting removal directly through your county’s website.
Purchase Details
Purchase Details
Home Values in the Area
Average Home Value in this Area
Purchase History
We collect this data history from publicly available records. To have your information removed, we recommend requesting removal directly through your county’s website.
| Date | Buyer | Sale Price | Title Company |
|---|---|---|---|
| -- | -- | ||
| -- | -- | ||
| -- | -- |
Mortgage History
We collect this data history from publicly available records. To have your information removed, we recommend requesting removal directly through your county’s website.
| Date | Status | Borrower | Loan Amount |
|---|---|---|---|
| Previous Owner | $25,000 | ||
| Previous Owner | $50,000 | ||
| Previous Owner | $60,000 | ||
| Previous Owner | $55,000 |
Tax History
We collect this data history from publicly available records. To have your information removed, we recommend requesting removal directly through your county’s website.
| Year | Tax Paid | Tax Assessment Tax Assessment Total Assessment is a certain percentage of the fair market value that is determined by local assessors to be the total taxable value of land and additions on the property. | Land | Improvement |
|---|---|---|---|---|
| 2025 | $6,637 | $485,500 | $213,800 | $271,700 |
| 2024 | $6,444 | $458,300 | $201,700 | $256,600 |
| 2023 | $6,269 | $411,900 | $175,300 | $236,600 |
| 2022 | $6,018 | $359,300 | $152,400 | $206,900 |
| 2021 | $5,549 | $321,100 | $138,500 | $182,600 |
| 2020 | $5,369 | $306,800 | $132,000 | $174,800 |
| 2019 | $5,256 | $293,300 | $125,700 | $167,600 |
| 2018 | $5,029 | $276,000 | $125,700 | $150,300 |
| 2017 | $4,884 | $264,300 | $125,700 | $138,600 |
| 2016 | $4,708 | $254,600 | $120,900 | $133,700 |
| 2015 | $4,917 | $258,400 | $125,500 | $132,900 |
| 2014 | $4,655 | $253,800 | $123,100 | $130,700 |
Map
- 383 Salem St
- 460 Salem St
- 6 Evergreen Cir
- 16 Hemlock St Unit 222
- 30 Leisurewoods Dr
- 14 Birch St Unit 118
- 575 Salem St
- 86 Leisurewoods Dr Unit 279
- 4 Birch St
- 7 Chestnut Cir
- 15 Canterbury Ln
- 6 Canterbury Ln
- 9 Juniper Cir
- 11 Chestnut Cir Unit 39
- 57 Battery St
- 364 North Ave
- 33 Brookline St
- 490 North Ave
- 4 Leslie Ct
- 181 Greenwood St
Ask me questions while you tour the home.