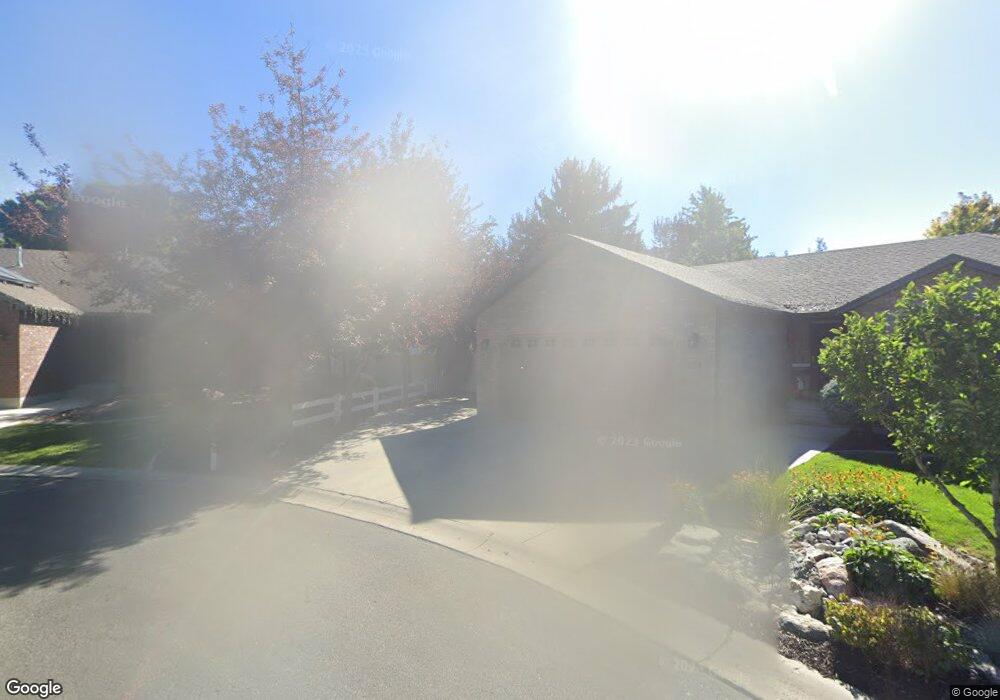
760 E 275 N Unit 2 Logan, UT 84321
Wilson NeighborhoodEstimated Value: $599,000 - $748,000
8
Beds
4
Baths
3,448
Sq Ft
$189/Sq Ft
Est. Value
About This Home
This home is located at 760 E 275 N Unit 2, Logan, UT 84321 and is currently estimated at $652,333, approximately $189 per square foot. 760 E 275 N Unit 2 is a home located in Cache County with nearby schools including Wilson School, Mount Logan Middle School, and Logan High School.
Ownership History
Date
Name
Owned For
Owner Type
Purchase Details
Closed on
Aug 24, 2017
Sold by
Easterling Patrick Mccloy
Bought by
Easterling Patrick M and Chung Brenda
Current Estimated Value
Purchase Details
Closed on
May 3, 2013
Sold by
Easterling Patrick Mccoly
Bought by
Easterling Patrick M and Chung Brenda
Purchase Details
Closed on
Sep 10, 2009
Sold by
Clavel Jose Antonio and Clavel Santos Del Carmen
Bought by
Easterling Patrick Mccloy
Purchase Details
Closed on
May 18, 2006
Sold by
Needham Family Partnership
Bought by
Clavel Jose Antonio and Clavel Santos Del Carmen
Home Financials for this Owner
Home Financials are based on the most recent Mortgage that was taken out on this home.
Original Mortgage
$150,500
Interest Rate
6.46%
Mortgage Type
Commercial
Create a Home Valuation Report for This Property
The Home Valuation Report is an in-depth analysis detailing your home's value as well as a comparison with similar homes in the area
Home Values in the Area
Average Home Value in this Area
Purchase History
We collect this data history from publicly available records. To have your information removed, we recommend requesting removal directly through your county’s website.
| Date | Buyer | Sale Price | Title Company |
|---|---|---|---|
| Easterling Patrick M | -- | Hickman Land Title Company | |
| Easterling Patrick M | -- | Accommodation | |
| Easterling Patrick Mccloy | -- | American Secure Title | |
| Clavel Jose Antonio | -- | Cache Title Company |
Source: Public Records
Mortgage History
We collect this data history from publicly available records. To have your information removed, we recommend requesting removal directly through your county’s website.
| Date | Status | Borrower | Loan Amount |
|---|---|---|---|
| Previous Owner | Clavel Jose Antonio | $150,500 |
Source: Public Records
Tax History
| Year | Tax Paid | Tax Assessment Tax Assessment Total Assessment is a certain percentage of the fair market value that is determined by local assessors to be the total taxable value of land and additions on the property. | Land | Improvement |
|---|---|---|---|---|
| 2025 | $2,941 | $691,650 | $178,500 | $513,150 |
| 2023 | $3,170 | $688,150 | $175,000 | $513,150 |
| 2022 | $3,395 | $688,150 | $175,000 | $513,150 |
| 2021 | $3,477 | $598,900 | $132,400 | $466,500 |
| 2020 | $2,261 | $350,500 | $90,000 | $260,500 |
| 2019 | $2,363 | $350,500 | $90,000 | $260,500 |
| 2018 | $2,502 | $338,800 | $70,000 | $268,800 |
| 2017 | $2,381 | $170,500 | $0 | $0 |
| 2016 | $2,469 | $119,570 | $0 | $0 |
| 2015 | $1,733 | $119,570 | $0 | $0 |
| 2014 | $1,567 | $119,570 | $0 | $0 |
| 2013 | -- | $111,130 | $0 | $0 |
Source: Public Records
Map
Nearby Homes
- 760 E 275 N
- 790 E 275 N Unit 2
- 790 E 275 N
- 709 Apple Dr Unit 5
- 709 Apple Dr
- 725 E 275 N
- 708 Apple Dr Unit 6
- 708 Apple Dr
- 800 E 275 N
- 705 Apple Dr Unit 4
- 729 E 200 N Unit 1
- 729 E 200 N Unit 2
- 729 E 200 N
- 715 E 200 N
- 745 E 275 N
- 785 E 275 N
- 696 Apple Dr Unit 7
- 696 Apple Dr
- 713 E 200 N Unit .28
- 713 E 200 N
Your Personal Tour Guide
Ask me questions while you tour the home.