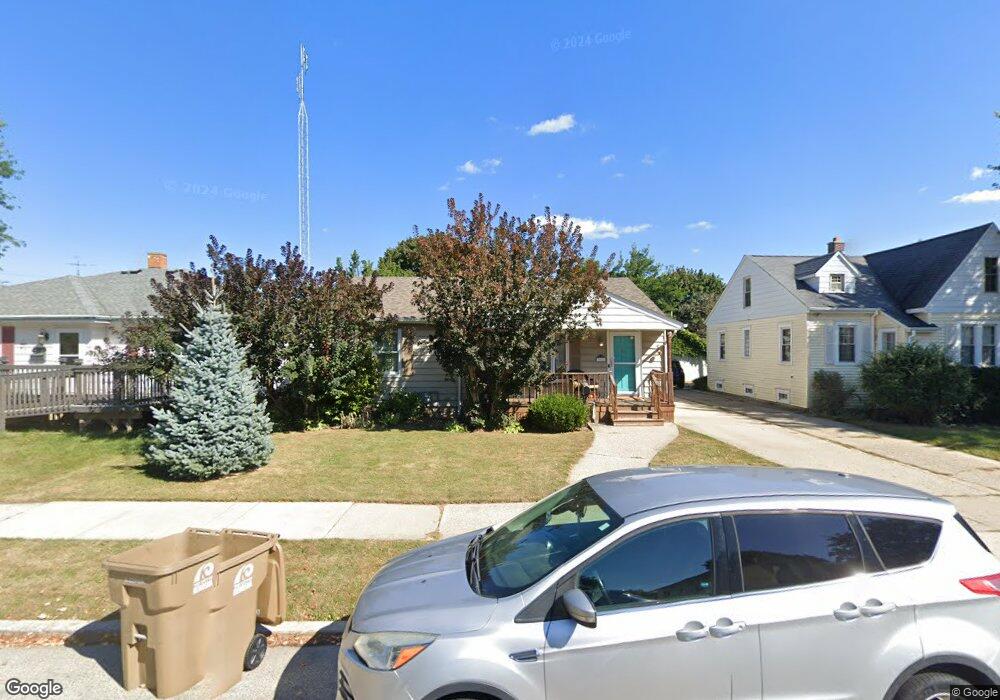
7623 26th Ave Kenosha, WI 53143
Sunnyside NeighborhoodEstimated Value: $259,000 - $314,000
3
Beds
2
Baths
1,328
Sq Ft
$219/Sq Ft
Est. Value
About This Home
This home is located at 7623 26th Ave, Kenosha, WI 53143 and is currently estimated at $291,340, approximately $219 per square foot. 7623 26th Ave is a home located in Kenosha County with nearby schools including Grewenow Elementary School, Lance Middle School, and Tremper High School.
Ownership History
Date
Name
Owned For
Owner Type
Purchase Details
Closed on
Apr 24, 2017
Sold by
Herrmann Joel M and Herrmann Samantha J
Bought by
Clark Justin A
Current Estimated Value
Home Financials for this Owner
Home Financials are based on the most recent Mortgage that was taken out on this home.
Original Mortgage
$158,083
Outstanding Balance
$130,993
Interest Rate
4.4%
Mortgage Type
FHA
Estimated Equity
$160,347
Purchase Details
Closed on
Oct 14, 2009
Sold by
Hamilton Michelle L
Bought by
Hermann Joel M and Hermann Samantha J
Create a Home Valuation Report for This Property
The Home Valuation Report is an in-depth analysis detailing your home's value as well as a comparison with similar homes in the area
Home Values in the Area
Average Home Value in this Area
Purchase History
We collect this data history from publicly available records. To have your information removed, we recommend requesting removal directly through your county’s website.
| Date | Buyer | Sale Price | Title Company |
|---|---|---|---|
| Clark Justin A | $161,000 | -- | |
| Hermann Joel M | $146,500 | -- |
Source: Public Records
Mortgage History
We collect this data history from publicly available records. To have your information removed, we recommend requesting removal directly through your county’s website.
| Date | Status | Borrower | Loan Amount |
|---|---|---|---|
| Open | Clark Justin A | $158,083 |
Source: Public Records
Tax History
| Year | Tax Paid | Tax Assessment Tax Assessment Total Assessment is a certain percentage of the fair market value that is determined by local assessors to be the total taxable value of land and additions on the property. | Land | Improvement |
|---|---|---|---|---|
| 2025 | $3,673 | $227,500 | $52,500 | $175,000 |
| 2024 | $3,523 | $151,300 | $38,900 | $112,400 |
| 2023 | $3,523 | $151,300 | $38,900 | $112,400 |
| 2022 | $3,572 | $151,300 | $38,900 | $112,400 |
| 2021 | $3,667 | $151,300 | $38,900 | $112,400 |
| 2020 | $3,792 | $151,300 | $38,900 | $112,400 |
| 2019 | $3,644 | $151,300 | $38,900 | $112,400 |
| 2018 | $3,585 | $128,200 | $38,900 | $89,300 |
| 2017 | $3,347 | $128,200 | $38,900 | $89,300 |
| 2016 | $3,271 | $128,200 | $38,900 | $89,300 |
| 2015 | $3,239 | $121,000 | $38,900 | $82,100 |
| 2014 | $3,187 | $121,000 | $38,900 | $82,100 |
Source: Public Records
Map
Nearby Homes
Your Personal Tour Guide
Ask me questions while you tour the home.