7623 Hart Rd Benton, AR 72019
Salem AreaEstimated Value: $232,000 - $411,000
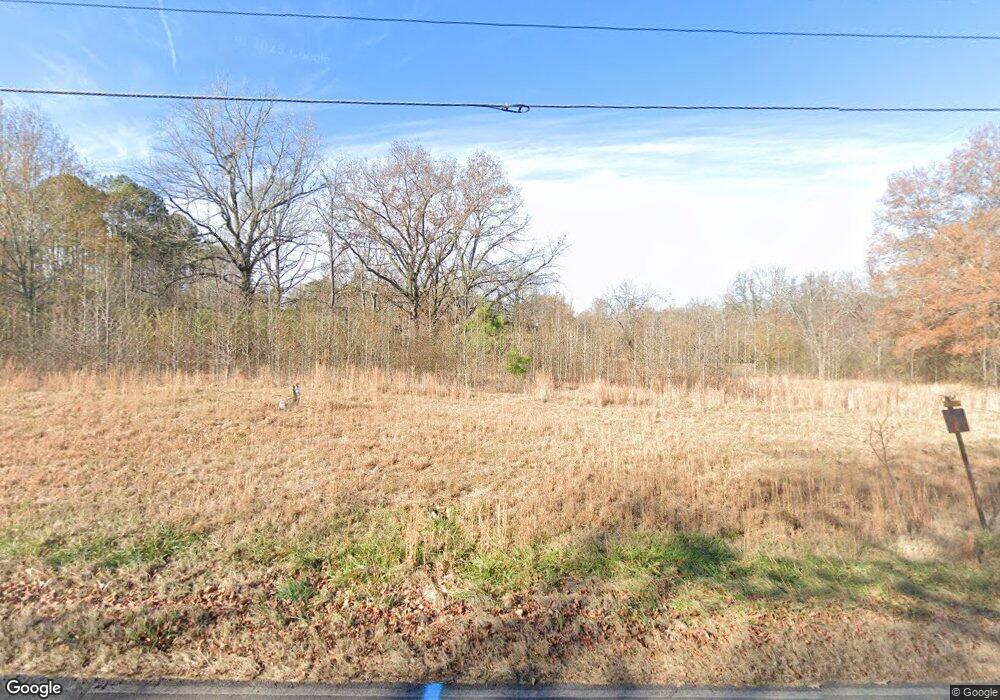
About This Home
This home is located at 7623 Hart Rd, Benton, AR 72019 and is currently estimated at $349,333, approximately $107 per square foot. 7623 Hart Rd is a home located in Saline County with nearby schools including Salem Elementary School.
Ownership History
We collect this data history from publicly available records. To have your information removed, we recommend requesting removal directly through your county’s website.
Purchase Details
Purchase Details
Home Financials for this Owner
Home Financials are based on the most recent Mortgage that was taken out on this home.Purchase Details
Home Financials for this Owner
Home Financials are based on the most recent Mortgage that was taken out on this home.Purchase Details
Home Values in the Area
Average Home Value in this Area
Purchase History
We collect this data history from publicly available records. To have your information removed, we recommend requesting removal directly through your county’s website.
| Date | Buyer | Sale Price | Title Company |
|---|---|---|---|
| -- | -- | ||
| -- | -- | ||
| $140,000 | -- | ||
| $140,000 | -- | ||
| -- | -- |
Mortgage History
We collect this data history from publicly available records. To have your information removed, we recommend requesting removal directly through your county’s website.
| Date | Status | Borrower | Loan Amount |
|---|---|---|---|
| Open | $1,345,000 | ||
| Closed | $136,598 | ||
| Closed | $132,620 |
Tax History
We collect this data history from publicly available records. To have your information removed, we recommend requesting removal directly through your county’s website.
| Year | Tax Paid | Tax Assessment Tax Assessment Total Assessment is a certain percentage of the fair market value that is determined by local assessors to be the total taxable value of land and additions on the property. | Land | Improvement |
|---|---|---|---|---|
| 2025 | $2,557 | $71,369 | $20,520 | $50,849 |
| 2024 | $2,384 | $71,369 | $20,520 | $50,849 |
| 2023 | $2,121 | $71,369 | $20,520 | $50,849 |
| 2022 | $2,059 | $71,369 | $20,520 | $50,849 |
| 2021 | $1,957 | $44,200 | $8,700 | $35,500 |
| 2020 | $1,907 | $44,200 | $8,700 | $35,500 |
| 2019 | $1,907 | $44,200 | $8,700 | $35,500 |
| 2018 | $1,932 | $44,200 | $8,700 | $35,500 |
| 2017 | $1,864 | $44,200 | $8,700 | $35,500 |
| 2016 | $1,914 | $40,820 | $8,700 | $32,120 |
| 2015 | $1,354 | $35,270 | $8,700 | $26,570 |
| 2014 | $1,354 | $34,930 | $8,700 | $26,230 |
Map
- 7804 Renee Cir
- 1713 Salem Rd
- 1129 Essex Dr
- 8409 Carrie Dr
- 8433 Renee Cir
- 8524 Hart Rd
- 1128 Essex Dr
- 1153 Essex Dr
- 7241 Ross Ln
- 7034 Westshore Ave
- 608 Cottage Ln
- 7015 Westshore Ave
- 7640 Congo Rd
- 7016 Westshore Ave
- 6856 Hilo Ave
- 6560 Westminster
- 1220 Pine Forest Dr
- 6736 Hilo
- 000 Salem Rd
- 7166 Moon View Place
Ask me questions while you tour the home.